GlassFish v3 provides a REST interface to management and monitoring information as discussed in TOTD #96. As mentioned in that blog "the REST interface is a lower level API that enables toolkit developers and IT administrators to write their custom scripts/clients using language of their choice". This blog introduces a tool that uses the REST API to provide management and monitoring of GlassFish v3 and is written using JavaFX.
This tool is only a proof-of-concept that demonstrates that GlassFish v3 REST interface is functionally very rich and can indeed be used to write third-party administration tools. The tool uses a subset of the REST interface and exposes only a limited amount of management and monitoring capabilities otherwise exposed. After all this is a proof-of-concept ![]()
A screencast of this tool in action along with a downloadable JNLP version will soon be available. For now, here is a snapshot of the main window of this tool:
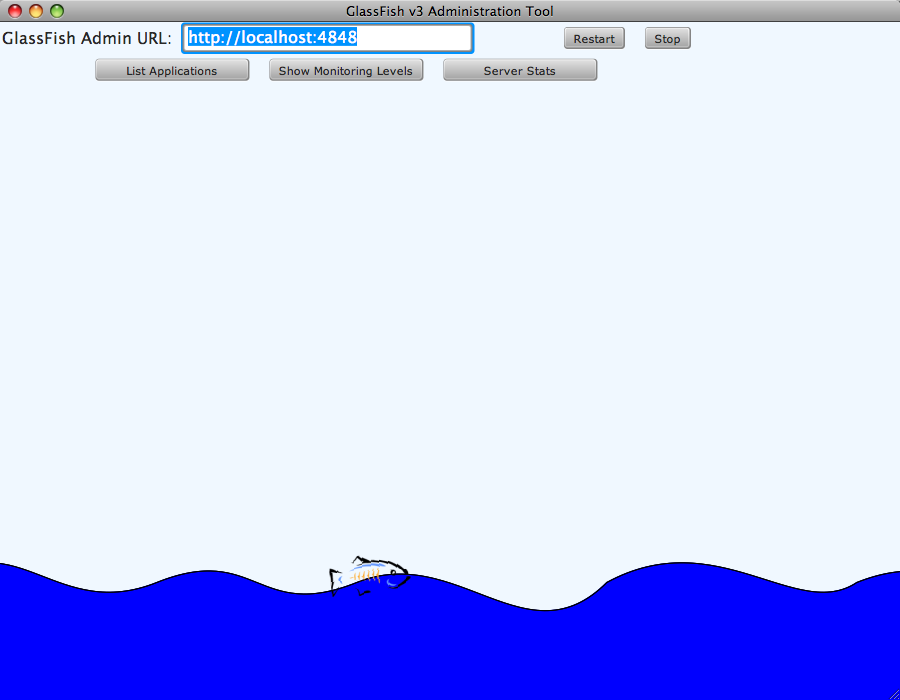
The main screen allows you to enter a URL for the GlassFish administration. Then the GlassFish instance can be stopped/restarted from the main window using the buttons on top right. There is an animation at the bottom of the screen where the glassfish is swimming in the ocean and is directly related to the state of server running in the background. If the server is running, the animation works. If the server is not running then the animation stops as well.
The main screen has three main buttons:
- "List Applications" – list all the applications deployed on the running instance
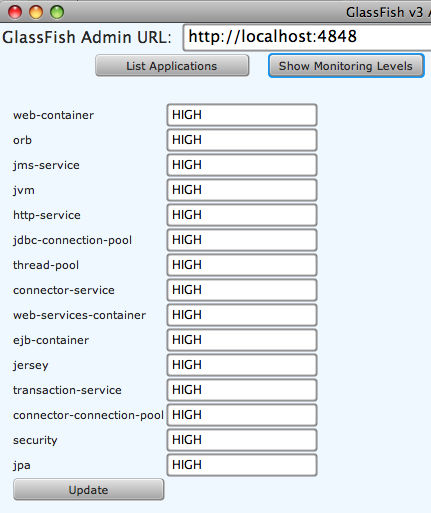
- "Show Monitoring Levels" – show/Update all the monitoring levels
- "Server Stats" – show statistics of the running server
Clicking on "List Applications" shows the list of applications deployed on this particular instance. Here is how a snapshot looks like for an instance running on my localhost at port 4848:
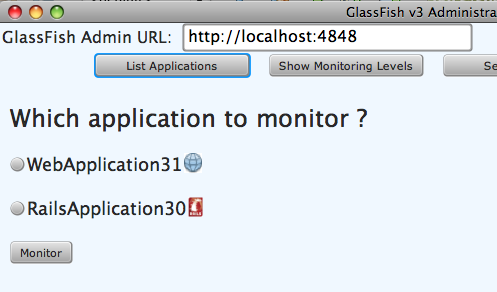
As shown in the screen, it shows a radio-bulleted list of all the applications. Each bullet is also accompanied by an image indicating the type of application – Web or Rails for now. Select the application and click on "Monitor" button to monitor that particular application. The REST API exposes a vast amount of monitoring data but a subset of monitoring data is displayed for Web and Rails application for now. Here is a snapshot of the monitoring data published for a Web application:
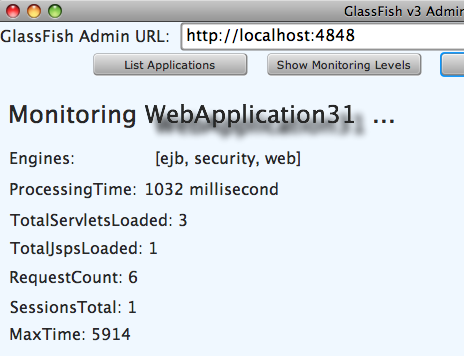
As evident by the list of engines, this web application has EJBs bundled as well. It also shows total number of Servlets/JSPs loaded, number of requests made to this web application and some other monitoring data.
Here is a snapshot of the monitoring data published for a Rails application:
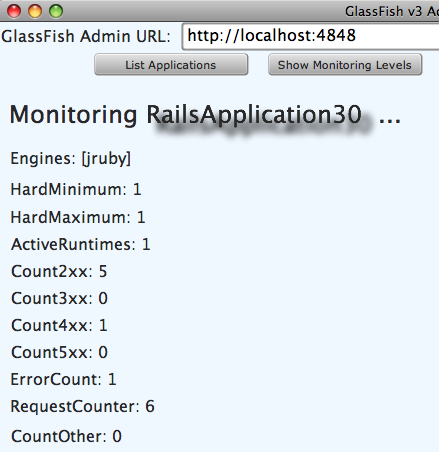
It shows number of JRuby runtimes configured for the application, number of requests sent to the application, number of responses with different HTTP access codes and some other data.
The monitoring levels of different containers can be easily updated by clicking on "Show Monitoring Levels" as shown below:
And finally some server statistics are shown by clicking on "Server Stats" as shown below:
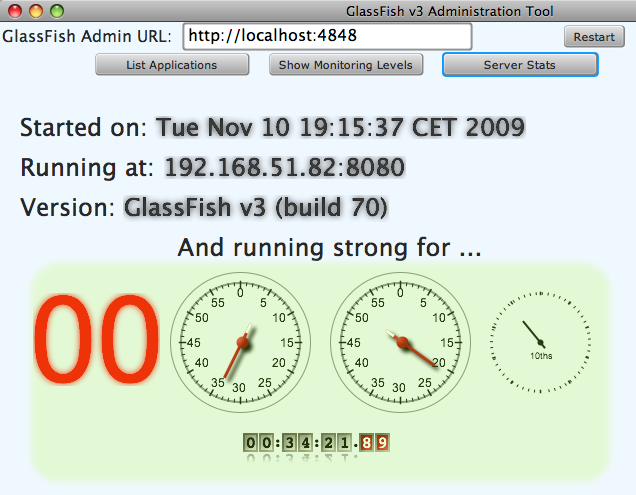
It shows when the server was started, host/port information, version and finally how long the server has been running for. The dials are an animation that shows the server up time.
Here are other related JavaFX and GlassFish related blogs published earlier:
- TOTD #23: JavaFX Client invoking a Metro endpoint
- JavaFX 1.0 launched – access services hosted on embedded GlassFish
How are you going to use the REST interface exposed by GlassFish v3 in your environment ?
Are you using JavaFX with GlassFish together in any way ?
Leave a comment on this blog if you do!
Technorati: javafx glassfish v3 rest web jruby rubyonrails rest administration monitoring management
Related posts:- TOTD #96: GlassFish v3 REST Interface to Monitoring and Management – JSON, XML, and HTML representations
- TOTD #105: GlassFish v3 Monitoring – How to monitor a Rails app using asadmin, JavaScript, jConsole, REST ?
- TOTD #67: How to front-end a GlassFish Cluster with Apache + mod_jk on Mac OSX Leopard ?
- TOTD #61: How to locally manage/monitor your Rails/Merb applications on JRuby/GlassFish using JMX ?
- LOTD #17: Sun GlassFish Enterprise Server Administration and Deployment Course – SAS 4455

