GlassFish Monitoring allows you to monitor the state of various runtime components of the application server. This information is used to identify performance bottlenecks and tuning the system for optimal performance, to aid capacity planning, to predict failures, to do root cause analysis in case of failures and sometimes to just ensure that everything is functioning as expected.
GlassFish Management allows you to manage the running Application Server instance such as query/create/delete resources (JDBC, JMS, etc), stop/restart the instance, rotate the log and other similar functions.
GlassFish v3 exposes Monitoring and Management data using a REST Interface. This Tip Of The Day (TOTD) shows how to play with this new functionality. Rajeshwar’s blog has lot of useful information on this topic.
Most of the functionality available in web-based Admin Console and CLI (asadmin) is now available using the REST interface. Both of these are pre-built tools that ships with the GlassFish bundle. The REST interface is a lower level API that enables toolkit developers and IT administrators to write their custom scripts/clients using language of their choice such as Java, JavaScript, Ruby or Groovy.
The default URL for the REST interface of monitoring is “http://localhost:4848/monitoring/domain” and for the management is “http://localhost:4848/management/domain”. Each URL provides an XML, JSON and HTML representation of the resources. If a web browser is used then a HTML representation is returned and displayed nicely in the browser. Rajeshwar’s blog described a Java client written using Jersey Client APIs that can be used to make all the GET/PUT/POST/DELETE requests. This blog will use something more basic, and extremely popular, to make all the RESTful invocations – cURL.
At this time the monitoring resources are read-only (GET) and management can be done using GET/POST/DELETE methods. POST is used for creating and updating resources/objects and the updates can be partial.
Lets get started.
- Download the latest continuous build from the trunk and unzip. This functionality is also available in the Web profile bundle. This blog is using build #2023.
- Start the application server as:
~/tools/glassfish/v3/2023/glassfishv3 >./bin/asadmin start-domain –verbose Aug 19, 2009 9:52:45 AM com.sun.enterprise.admin.launcher.GFLauncherLogger info
INFO: JVM invocation command line:
/System/Library/Frameworks/JavaVM.framework/Versions/1.6/Home/bin/java
-cp. . .
INFO: felix.fileinstall.dir /Users/arungupta/tools/glassfish/v3/2023/glassfishv3/glassfish/domains/domain1/autodeploy-bundles
Aug 19, 2009 9:53:05 AM
INFO: felix.fileinstall.debug 1
Aug 19, 2009 9:53:05 AM
INFO: felix.fileinstall.bundles.new.start true - Monitoring information – Lets monitor this GlassFish instance using the REST interface.
- Retrieve JSON information – As mentioned above, the monitoring resources are read-only and so the information can be accessed as:
~/tools/glassfish/v3/2023/glassfishv3 >curl -H “Accept: application/json” http://localhost:4848/monitoring/domain -v
* About to connect() to localhost port 4848 (#0)
* Trying ::1… connected
* Connected to localhost (::1) port 4848 (#0)
> GET /monitoring/domain HTTP/1.1
> User-Agent: curl/7.16.3 (powerpc-apple-darwin9.0) libcurl/7.16.3 OpenSSL/0.9.7l zlib/1.2.3
> Host: localhost:4848
> Accept: application/json
>
< HTTP/1.1 200 OK
< Content-Type: application/json
< Transfer-Encoding: chunked
< Date: Wed, 19 Aug 2009 17:40:29 GMT
<
{Domain:{},”child-resources”:["http://localhost:4848/monitoring/domain/server"]}
* Connection #0 to host localhost left intact
* Closing connection #0The command explicitly asks for JSON representation of the resources. The outbound headers are prepended with “>” and inbound headers with “<”. And the JSON representation is shown in the last line as:
{Domain:{},”child-resources”:["http://localhost:4848/monitoring/domain/server"]} The key element to remember here is “http://localhost:4848/monitoring/domain/server” which can be used to retrieve more monitoring information.
- XML represetation: Lets change the command to ask for XML representation as:
~/tools/glassfish/v3/2023/glassfishv3 >curl -H “Accept: application/xml” http://localhost:4848/monitoring/domain -v
* About to connect() to localhost port 4848 (#0)
* Trying ::1… connected
* Connected to localhost (::1) port 4848 (#0)
> GET /monitoring/domain HTTP/1.1
> User-Agent: curl/7.16.3 (powerpc-apple-darwin9.0) libcurl/7.16.3 OpenSSL/0.9.7l zlib/1.2.3
> Host: localhost:4848
> Accept: application/xml
>
< HTTP/1.1 200 OK
< Content-Type: application/xml
< Transfer-Encoding: chunked
< Date: Wed, 19 Aug 2009 17:43:51 GMT
<
<Domain>
<child-resource>http://localhost:4848/monitoring/domain/server</child-resource>
</Domain>
* Connection #0 to host localhost left intact
* Closing connection #0The command changes the “Accept” header to “application/xml” and now the XML representation of the monitoring resources is returned as:
<Domain>
<child-resource>http://localhost:4848/monitoring/domain/server</child-resource>
</Domain> - HTML representation: The command can be altered to get the HTML representation as “curl -H “Accept: text/html” http://localhost
:4848/monitoring/domain -v“. But HTML is more pleasant when rendered by a browser and so viewing the page “http://localhost:4848/monitoring/domain” in the browser is shown as: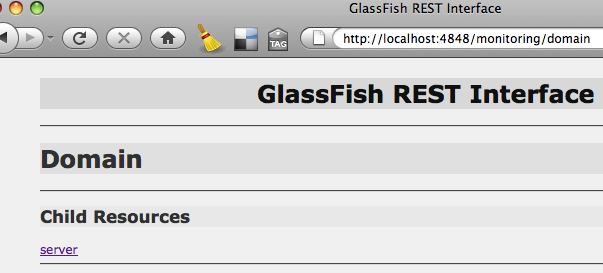
- Get more information: As mentioned above, more information about this GlassFish instance can be accessed by GETing from “http://localhost:4848/monitoring/domain/server” and here is the result:
</tools/glassfish/v3/2023/glassfishv3 >curl -H “Accept: application/json” http://localhost:4848/monitoring/domain/server -v
* About to connect() to localhost port 4848 (#0)
* Trying ::1… connected
* Connected to localhost (::1) port 4848 (#0)
> GET /monitoring/domain/server HTTP/1.1
> User-Agent: curl/7.16.3 (powerpc-apple-darwin9.0) libcurl/7.16.3 OpenSSL/0.9.7l zlib/1.2.3
> Host: localhost:4848
> Accept: application/json
>
< HTTP/1.1 200 OK
< Content-Type: application/json
< Transfer-Encoding: chunked
< Date: Wed, 19 Aug 2009 17:56:41 GMT
<
{Server:{},”child-resources”:["http://localhost:4848/monitoring/domain/server/webintegration",
"http://localhost:4848/monitoring/domain/server/transaction-service",
"http://localhost:4848/monitoring/domain/server/network",
"http://localhost:4848/monitoring/domain/server/jvm",
"http://localhost:4848/monitoring/domain/server/web",
"http://localhost:4848/monitoring/domain/server/realm",
"http://localhost:4848/monitoring/domain/server/http-service"]}
* Connection #0 to host localhost left intact
* Closing connection #0An HTML rendering of this representation looks like:
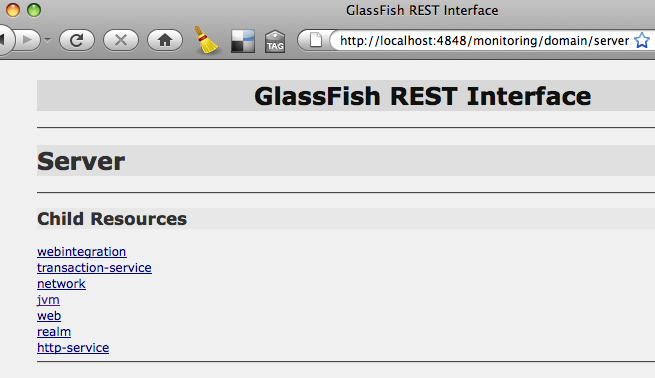
You can keep clicking on the links and more detailed information about that resource is displayed. This is just one HTML representation and is purposely kept light-weight. You can certainly grab the XML representation and apply an XSLT to generate your own HTML rendering.
The monitoring levels for different modules can be easily changed using the management REST interface as explained below.
- Retrieve JSON information – As mentioned above, the monitoring resources are read-only and so the information can be accessed as:
- Management of the GlassFish instance
- Lets see all the options supported by management REST interface as:
~/tools/glassfish/v3/2023/glassfishv3 >curl -X OPTIONS http://localhost:4848/management/domain -v
* About to connect() to localhost port 4848 (#0)
* Trying ::1… connected
* Connected to localhost (::1) port 4848 (#0)
> OPTIONS /management/domain HTTP/1.1
> User-Agent: curl/7.16.3 (powerpc-apple-darwin9.0) libcurl/7.16.3 OpenSSL/0.9.7l zlib/1.2.3
> Host: localhost:4848
> Accept: */*
>
< HTTP/1.1 200 OK
< Content-Type: application/json
< Transfer-Encoding: chunked
< Date: Wed, 19 Aug 2009 18:07:14 GMT
<
{
“Method”:”GET”“Method”:”PUT”
}
* Connection #0 to host localhost left intact
* Closing connection #0Specifying “-X OPTIONS” switch displays the various HTTP methods supported by the REST interface. Even though the results show GET and PUT, but it really means GET and POST (issue #9177). Lets try “GET” first.
- GET JSON information as:
~/tools/glassfish/v3/2023/glassfishv3 >curl -H “Accept: application/json” http://localhost:4848/management/domain -v
* About to connect() to localhost port 4848 (#0)
* Trying ::1… connected
* Connected to localhost (::1) port 4848 (#0)
> GET /management/domain HTTP/1.1
> User-Agent: curl/7.16.3 (powerpc-apple-darwin9.0) libcurl/7.16.3 OpenSSL/0.9.7l zlib/1.2.3
> Host: localhost:4848
> Accept: application/json
>
< HTTP/1.1 200 OK
< Content-Type: application/json
< Transfer-Encoding: chunked
< Date: Wed, 19 Aug 2009 18:14:46 GMT
<
{Domain:{“log-root” : “${com.sun.aas.instanceRoot}/logs”,”application-root” : “${com.sun.aas.instanceRoot}/applications”,”locale” : “”,”version” : “re-continuous”},”child-resources”:["http://localhost:4848/management/domain/configs",
"http://localhost:4848/management/domain/resources","http://localhost:4848/management/domain/servers",
"http://localhost:4848/management/domain/property","http://localhost:4848/management/domain/applications",
"http://localhost:4848/management/domain/system-applications","http://localhost:4848/management/domain/stop",
"http://localhost:4848/management/domain/restart","http://localhost:4848/management/domain/uptime",
"http://localhost:4848/management/domain/version","http://localhost:4848/management/domain/rotate-log",
"http://localhost:4848/management/domain/host-port"]}
* Connection #0 to host localhost left intact
* Closing connection #0As the result shows, there are several RESTful URLs available (in “child-resources” element) to manage this GlassFish instance. For example:
- Show the host/port of GlassFish instance as:
curl -H “Accept: application/json” http://localhost:4848/management/domain/host-port -v will show the result as:
{“GetHostAndPort”:{“value” : “dhcp-usca14-132-79.SFBay.Sun.COM:8080″}} - Show that web-based Admin Console is pre-installed as system application using:
curl -H “Accept: application/json” http://localhost:4848/management/domain/system-applications/application/__admingui -v will show the result as:
{__admingui:{“libraries” : “”,”availability-enabled” : “false”,”enabled” : “true”,”context-root” : “”,”location” : “${com.sun.aas.installRootURI}/lib/install/applications/__admingui”,”description” : “”,”name” : “__admingui”,”directory-deployed” : “true”,”object-type” : “system-admin”},”child-resources”:["http://localhost:4848/management/domain/system-applications/application/__admingui/module"]} td> - Query the monitoring levels of different modules as:
curl -H “Accept: application/json” http://localhost:4848/management/domain/configs/config/server-config/monitoring-service/module-monitoring-levels -v to see the result as:
{ModuleMonitoringLevels:{“transaction-service” : “OFF”,”ejb-container” : “OFF”,”jdbc-connection-pool” : “OFF”,”orb” : “OFF”,”http-service” : “OFF”,”connector-connection-pool” : “OFF”,”jms-service” : “OFF”,”connector-service” : “OFF”,”jvm” : “OFF”,”thread-pool” : “OFF”,”web-container” : “OFF”},”child-resources”:[]} And then change the monitoring level of Web container as:
~/tools/glassfish/v3/2023/glassfishv3 >curl -X POST -d “web-container=ON” -H “Accept: application/json” http://localhost:4848/management/domain/configs/config/server-config/monitoring-service/module-monitoring-levels -v
* About to connect() to localhost port 4848 (#0)
* Trying ::1… connected
* Connected to localhost (::1) port 4848 (#0)
> POST /management/domain/configs/config/server-config/monitoring-service/module-monitoring-levels HTTP/1.1
> User-Agent: curl/7.16.3 (powerpc-apple-darwin9.0) libcurl/7.16.3 OpenSSL/0.9.7l zlib/1.2.3
> Host: localhost:4848
> Accept: application/json
> Content-Length: 16
> Content-Type: application/x-www-form-urlencoded
>
< HTTP/1.1 200 OK
< Content-Type: application/json
< Transfer-Encoding: chunked
< Date: Wed, 19 Aug 2009 22:01:31 GMT
<
* Connection #0 to host localhost left intact
* Closing connection #0
“http://localhost:4848/management/domain/configs/config/server-config/monitoring-service/module-monitoring-levels” updated successfullyThe last line shows that the monitoring level is successfull updated and can be verified again as:
~/tools/glassfish/v3/2023/glassfishv3 >curl -H “Accept: application/json” http://localhost:4848/management/domain/configs/config/server-config/monitoring-service/module-monitoring-levels -v
* About to connect() to localhost port 4848 (#0)
* Trying ::1… connected
* Connected to localhost (::1) port 4848 (#0)
> GET /management/domain/configs/config/server-config/monitoring-service/module-monitoring-levels HTTP/1.1
> User-Agent: curl/7.16.3 (powerpc-apple-darwin9.0) libcurl/7.16.3 OpenSSL/0.9.7l zlib/1.2.3
> Host: localhost:4848
> Accept: application/json
>
< HTTP/1.1 200 OK
< Content-Type: application/json
< Transfer-Encoding: chunked
< Date: Wed, 19 Aug 2009 22:36:47 GMT
<
* Connection #0 to host localhost left intact
* Closing connection #0
{ModuleMonitoringLevels:{“transaction-service” : “OFF”,”ejb-container” : “OFF”,”jdbc-connection-pool” : “OFF”,”orb” : “OFF”,”http-service” : “OFF”,”connector-connection-pool” : “OFF”,”jms-service” : “OFF”,”connector-service” : “OFF”,”jvm” : “OFF”,”thread-pool” : “OFF”,”web-container” : “ON”},”child-resources”:[]} - Stop this GlassFish instance using:
curl -H “Accept: application/json” http://localhost:4848/management/domain/stop -v Or restart the instance using:
curl -H “Accept: application/json” http://localhost:4848/management/domain/restart -v - Create a JDBC resource using an existing connection pool
- Lets see all the resources that are available:
curl -H “Accept: application/json” http://localhost:4848/management/domain/resources -v and the results are shown as:
{Resources:{},”child-resources”:["http://localhost:4848/management/domain/resources/jdbc-connection-pool",
"http://localhost:4848/management/domain/resources/jdbc-resource"]} - View all the JDBC connection pools as:
curl -H “Accept: application/json” http://localhost:4848/management/domain/resources/jdbc/connection-pool -v and the results are shown as:
{JdbcConnectionPool:{},”child-resources”:["http://localhost:4848/management/domain/resources/jdbc-connection-pool/__TimerPool",
"http://localhost:4848/management/domain/resources/jdbc-connection-pool/DerbyPool"]} - See all the JDBC resources available as:
curl “Accept: application/json” http://localhost:4848/management/domain/resources/jdbc-resource -v and the results are shown as:
{JdbcResource:{},”child-resources”:["http://localhost:4848/management/domain/resources/jdbc-resource/jdbc/__TimerPool",
"http://localhost:4848/management/domain/resources/jdbc-resource/jdbc/__default"]} - See all the OPTIONS accepted for JDBC resource creation as:
curl -X OPTIONS -H “Accept: application/json” http://localhost:4848/management/domain/resources/jdbc-resource -v with the result as:
{
“Method”:”POST”,
“Message Parameters”:{
“id”:{“Acceptable Values”:”",”Default Value”:”",”Type”:”class java.lang.String”,”Optional”:”false”},
“enabled”:{“Acceptable Values”:”",”Default Value”:”true”,”Type”:”class java.lang.Boolean”,”Optional”:”true”},
“description”:{“Acceptable Values”:”",”Default Value”:”",”Type”:”class java.lang.String”,”Optional”:”true”},
“target”:{“Acceptable Values”:”",”Default Value”:”",”Type”:”class java.lang.String”,”Optional”:”true”},
“property”:{“Acceptable Values”:”",”Default Value”:”",”Type”:”class java.util.Properties”,”Optional”:”true”},
“connectionpoolid”:{“Acceptable Values”:”",”Default Value”:”",”Type”:”class java.lang.String”,”Optional”:”false”}
}“Method”:”GET”
- Finally, create the JDBC resource as:
~/tools/glassfish/v3/2023/glassfishv3 >curl -d “id=jdbc/sample&connectionpoolid=DerbyPool” http://localhost:4848/management/domain/resources/jdbc-resource -v
* About to connect() to localhost port 4848 (#0)
* Trying ::1… connected
* Connected to localhost (::1) port 4848 (#0)
> POST /management/domain/resources/jdbc-resource HTTP/1.1
> User-Agent: curl/7.16.3 (powerpc-apple-darwin9.0) libcurl/7.16.3 OpenSSL/0.9.7l zlib/1.2.3
> Host: localhost:4848
> Accept: */*
> Content-Length: 42
> Content-Type: application/x-www-form-urlencoded
>
< HTTP/1.1 201 Created
< Content-Type: text/html
< Transfer-Encoding: chunked
< Date: Wed, 19 Aug 2009 20:45:51 GMT
<
* Connection #0 to host localhost left intact
* Closing connection #0
“http://localhost:4848/management/domain/resources/jdbc-resource/jdbc/sample” created successfully.Note, this is a POST request. The JDBC resource name and JDBC connection pool id are passed as CLI parameters using “-d” switch. The last line shows that the JDBC resource was created successfully.
- And finally query the JDBC Resources again as:
curl -H “Accept: application/json” http://localhost:4848/management/domain/resources/jdbc-resource -v to see the updated result as:
{JdbcResource:{},”child-resources”:["http://localhost:4848/management/domain/resources/jdbc-resource/jdbc/__TimerPool",
"http://localhost:4848/management/domain/resources/jdbc-resource/jdbc/__default",
"http://localhost:4848/management/domain/resources/jdbc-resource/jdbc/sample"]}
Similarly JDBC connection pools can be created.
- Lets see all the resources that are available:
- Show the host/port of GlassFish instance as:
- POST can be used to update the top-level attributes such as “log-root” and “application-root”. The name of these attributes are shown in the result of GET.
- As earlier, XML representation of management resources can be obtained as:
~/tools/glassfish/v3/2023/glassfishv3 >curl -H “Accept: application/xml” http://localhost:4848/management/domain -v
* About to connect() to localhost port 4848 (#0)
* Trying ::1… connected
* Connected to localhost (::1) port 4848 (#0)
> GET /management/domain HTTP/1.1
> User-Agent: curl/7.16.3 (powerpc-apple-darwin9.0) libcurl/7.16.3 OpenSSL/0.9.7l zlib/1.2.3
> Host: localhost:4848
> Accept: application/xml
>
< HTTP/1.1 200 OK
< Content-Type: application/xml
< Transfer-Encoding: chunked
< Date: Wed, 19 Aug 2009 18:17:07 GMT
<
<Domain log-root=”${com.sun.aas.instanceRoot}/logs” application-root=”${com.sun.aas.instanceRoot}/applications” locale=”" version=”re-continuous”>
<child-resource>http://localhost:4848/management/domain/configs</child-resource>
<child-resource>http://localhost:4848/management/domain/resources</child-resource>
<child-resource>http://localhost:4848/management/domain/servers</child-resource>
<child-resource>http://localhost:4848/management/domain/property</child-resource>
<child-resource>http://localhost:4848/management/domain/applications</child-resource>
<child-resource>http://localhost:4848/management/domain/system-applications</child-resource>
<child-resource>http://localhost:4848/management/domain/stop</child-resource>
<child-resource>http://localhost:4848/management/domain/restart</child-resource>
<child-resource>http://localhost:4848/management/domain/uptime</child-resource>
<child-resource>http://localhost:4848/management/domain/version</child-resource>
<child-resource>http://localhost:4848/management/domain/rotate-log</child-resource>
<child-resource>http://localhost:4848/management/domain/host-port</child-resource>
* Connection #0 to host localhost left intact
* Closing connection #0Just changing the “Accept” header to “application/xml” did the trick.
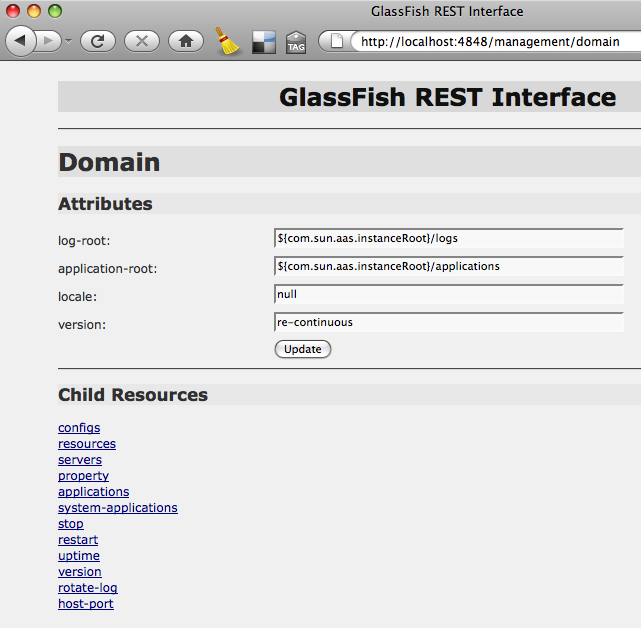
- And an HTML representation can be obtained by viewing the URL “http://localhost:4848/management/domain” in the browser with result as:
- Lets see all the options supported by management REST interface as:
Just like GlassFish v3, the REST interface is extensible as well. So if a new container is plugged in that generates data (possibly through probes) captured in the runtime tree, that is automatically exposed in the RESTful interface.
Now for the Mac users, Safari prefers XML over HTML. Basically a resource, that can be served using both XML and HTML representation (as our Management and Monitoring interface), is served as XML by Safari and HTML by Firefox. So use Firefox on Mac if you want HTML rendering.
How will you use GlassFish RE
ST interface ?
Do your application server provide that level of administration capability ?
Please leave suggestions on other TOTD that you’d like to see. A complete archive of all the tips is available here.
Technorati: totd glassfish v3 rest management monitoring jersey