Category Archives: containers

Gossip-based Kubernetes Cluster on AWS using Kops

Creating a Kubernetes cluster using Kops requires a top-level domain or a sub domain and setting up Route 53 hosted zones. This domain allows the worker nodes to discover the master and the master to discover all the etcd servers. This is also needed for kubectl to be able to talk directly with the master. This worked well but an additional hassle for the developers.

Kubernetes Logo

Kops 1.6.2 adds an experimental support for gossip-based, uses Weave Mesh, discovery of nodes. This makes the process of setting up Kubernetes cluster using Kops DNS-free, and much more simplified.

Let’s take a look!

  1. Install or upgrade kops:
  2. Check the version:
  3. Create an S3 bucket as “state store”:
  4. Create a Kubernetes cluster:
    It shows the output as:
    Wait for a few minutes for the cluster to be created.
  5. Validate the cluster:
  6. Get the list of nodes using kubectl:
  7. Deleting a cluster is pretty straight forward as well:

That’s it!

github.com/arun-gupta/kubernetes-java-sample provide several examples of getting started with Kubernetes.

File issues at github.com/kubernetes/kops/issues.


Creating Smaller Java Image using Docker Multi-stage Build

Two of the announcements at DockerCon 2017 directly relevant to Java developers are:

  • Docker Multi-stage build
  • Oracle JRE in Docker Store

This blog explains the purpose of Docker multi-stage build and provide examples of how they help us generate smaller and more efficient Java Docker images.

Docker Multi-stage Build

Just show me the code: github.com/arun-gupta/docker-java-multistage.

What is the issue?

Building a Docker image for a Java application typically involves building the application and package the generated artifact into an image. A Java developer would likely use Maven or Gradle to build a JAR or WAR file. If you are using the Maven base image to build the application then it will download the required dependencies from the configured repositories and keep them in the image. The number of JARs in the local repository could be significant depending upon the number of dependencies in the pom.xml. This could leave a lot of cruft in the image.

Let’s take a look at a sample Dockerfile:

In this Dockerfile:

  • maven:3.5-jdk-8 is used as the base image
  • Application source code is copied to the image
  • Maven is used to build the application artifact
  • WildFly is downloaded and installed
  • Generated artifact is copied to the deployments directory of WildFly
  • Finally, WildFly is started

There are several issues with this kind of flow:

  • Using maven as the base image restricts on what functionality is available in the image. This requires WildFly to be downloaded and configured explicitly.
  • Building the artifact downloads all Maven dependencies. These stay in the image and are not needed at runtime. This causes an unnecessary bloat in the image size at runtime.
  • Change in WildFly version will require to update the Dockerfile. This would’ve been much easier if we could use the jboss/wildfly base image by itself.
  • In addition, unit tests may run before packaging the artifact and integration tests after the image is created. The test dependencies and results is again not needed to live in the production image.

There are other ways to build the Docker image. For example, splitting the Dockerfile into two files. The first file will then build the artifact and copy the artifact to a common location using volume mapping. The second file will then pick up the generated artifact and then use the lean base image. This approach has also has issues where multiple Dockerfiles need to be maintained separately. Additional, there is an out-of-band hand-off between the two Dockerfiles.

Let’s see how these issues are resolved with multi-stage build.

What are Docker multi-stage build?

Multi-stage build allows multiple FROM statements in a Dockerfile. The instructions following each FROM statement and until the next one, creates an intermediate image. The final FROM statement is the final base image. Artifacts from intermediate stages can be copied using COPY --from=<image-number>, starting from 0 for the first base image. The artifacts not copied over are discarded. This allows to keep the final image lean and only include the relevant artifacts.

FROM syntax is updated to specify stage name using as <stage-name>. For example:

This allows to use the stage name instead of the number with --from option.

Let’s take a look at a sample Dockerfile:

In this Dockerfile:

  • There are two FROM instructions. This means this is a two-stage build.
  • maven:3.5-jdk-8 is the base image for the first build. This is used to build the WAR file for the application. The first stage is named as BUILD.
  • jboss/wildfly:10.1.0.Final is the second and the final base image for the build. WAR file generated in the first stage is copied over to this stage using COPY --from syntax. The file is directly copied in the WildFly deployments directory.

Let’s take a look at what are some of the advantages of this approach.

Advantages of Docker multi-stage build

  • One Dockerfile has the entire build process defined. There is no need to have separate Dockerfiles and then coordinate transfer of artifact between “build” Dockerfile and “run” Dockerfile using volume mapping.
  • Base image for the final image can be chosen appropriately to meet the runtime needs. This helps with reduction of the overall size of the runtime image. Additionally, the cruft from build time is discarded during intermediate stage.
  • Standard WildFly base image is used instead of downloading and configuring the distribution manually. This makes it a lot easier to update the image if a newer tag is released.

Size of the image built using a single Dockerfile is 816MB. In contrast, the size of the image built using multi-stage build is 584MB.

Docker Multi-stage Java Image

So, using a multi-stage helps create a much smaller image.

Is this a typical way of building Docker image? Are there other ways by which the image size can be reduced?

Sure, you can use docker-maven-plugin as shown at github.com/arun-gupta/docker-java-sample to build/test the image locally and then push to repo. But this mechanism allows you to generate and package artifact without any other dependency, including Java.

Sure, maven:jdk-8-alpine image can be used to create a smaller image. But then you’ll have to create or find a WildFly image built using jdk-8-alpine, or something similar, as well. But the cruft, such as maven repository, two Dockerfiles, sharing of artifact using volume mapping or some other similar technique would still be there.

There are other ways to craft your build cycle. But if you are using Dockerfile to build your artifact then you should seriously consider multi-stage builds.

Read more discussion in PR #31257.

As mentioned earlier, the complete code for this is available at github.com/arun-gupta/docker-java-multistage.

Sign up for Docker Online Meetup to get a DockerCon 2017 recap.

Docker Remote API on Windows and OSX

There are multiple ways to monitor Docker containers.

  • Docker CLI provides the docker container stats API that gives basic information about the running containers.
  • Docker Remote API provides more detailed information about the containers.
  • Starting with Docker 1.13, there is an experimental feature with a Prometheus endpoint
  • cAdvisor is an open source tool that provides last container usage and performance characteristics. This data can be stored in a time series database, such as InfluxDB. This data can then be shown in a fancy graph using a Kibana dashboard.

These options were covered in detail in an earlier blog.

There are other commercial options like Docker EE, Sysdig, Datadog, New Relic, App Dynamics and others. If you are running containers on AWS, then CloudWatch can provide integrated monitoring.

OSX is my primary development platform. But recently, I needed a way to monitor Docker containers using the Remote API (aka REST API) on a Windows machine. The output of the REST API is exactly same independent of the operating system. But the way to access the Docker REST API using curl is different on an OSX and a Windows machine. This blog will explain how to exactly access this API on these two operating systems.

Check out 1.27 swagger specification to learn more about the capabilities of the REST API. A nicer and a more readable version of the API can be seen using Swagger UI. This is broken until #32649 is fixed.

Complete details about how the REST API corresponds to different Docker versions is explained in Docker REST API Versioning.

We’ll dig into this a bit later but first let’s take a look on how this API can be accessed.

Docker Remote API on OSX

On OSX, curl connects using a Unix domain socket as shown:

A WildFly container can be started as:

Stats can then be obtained using the command:

This will start printing stats as:

These stats are refreshed every second.

Any other REST API can be invoked very easily with this. This is simple and straight forward.

Install Docker on Windows

Docker installation on Windows depends on the flavor of your operating system.

Are you using Windows 10+ Pro 64-bit, then use Docker for Windows.

If using any older version of Windows, then you need to use Docker Toolbox.

Are you installing Windows in a virtual machine? Then Virtual Box cannot be used to create the VM. This is because Virtual Box does not support nested virtualization. This is required as Docker Toolbox uses Virtual Box to create and start Docker Machine. VMWare Fusion seems to work fine here though.

Now that you know that VMWare Fusion needs to be used, make sure you enable nested virtualization before starting the virtual machine.

Many thanks to Stefan Scherer (@stefscherer) for helping me understand the Windows configuration details.

Let’s see how the Docker REST API can now be invoked.

Docker Remote API on Windows 7/8

This section shows how to invoke the REST API using curl on Windows 7/8.

The REST API can be invoked using curl as shown:

First of all, the REST API, /containers/<name-or-id>/stats, is exactly the same. The way this API can be invoked is a bit different.

There are four differences: The first three parameters specify security credentials for the Docker Machine generated by Docker Toolbox on your Windows box:

  • <CERT> is the SSL certificate for Docker Machine
  • <CA_CERT> is the Certificate Authority certificate for the Docker Machine
  • <KEY> is the key generated for the Docker Machine

The values of these configuration parameters is those generated by docker-machine CLI.

The last change is that the protocol is changed from http to https.

Here is the exact command that worked on Windows 7 VM:

This invocation will print the exact same stats output on Windows 7 VM.

Now that you know how to use this API on OSX and Windows, you can also this API to do everything that Docker CLI. This is because the Docker CLI is just a convenient wrapper over the REST API. So a docker container run command is invoking the appropriate REST API on the Docker Host.

Docker Remote API on Windows 10

If you are using Windows 10, then use Docker for Windows. After that, you need to figure out which curl command to be used. There are couple of options:

  • Use Bash shell on Windows. It has curl command that works like Unix command that we all know pretty well. In this case, the REST API can be invoked as:
    Docker for Windows listens on port 2375 on Windows.
  • If you are Powershell user, then install curl command as:
    Now the command to invoke the REST API is:
    Note, there is a curl alias in Powershell and that is an alias for Invoke-WebRequest. So make sure to use curl.exe to invoke the REST API as this is the command installed using Chocolatey.

This blog provided different options of how to invoke the Docker Remote API using curl on Windows and OSX.
 

Service Discovery with Java and Database application in Kubernetes

This blog will show how a simple Java application can talk to a database using service discovery in Kubernetes.

 Kubernetes Logo WildFly Logo

Service Discovery with Java and Database application in DC/OS explains why service discovery is an important aspect for a multi-container application. That blog also explained how this can be done for DC/OS.

Let’s see how this can be accomplished in Kubernetes with a single instance of application server and database server. This blog will use WildFly for application server and Couchbase for database.

This blog will use the following main steps:

  • Start Kubernetes one-node cluster
  • Kubernetes application definition
  • Deploy the application
  • Access the application

Start Kubernetes Cluster

Minikube is the easiest way to start a one-node Kubernetes cluster in a VM on your laptop. The binary needs to be downloaded first and then installed.

Complete installation instructions are available at github.com/kubernetes/minikube.

The latest release can be installed on OSX as as:

It also requires kubectl to be installed. Installing and Setting up kubectl provide detailed instructions on how to setup kubectl. On OSX, it can be installed as:

Now, start the cluster as:

The kubectl version command shows more details about the kubectl client and minikube server version:

More details about the cluster can be obtained using the kubectl cluster-info command:

Kubernetes Application Definition

Application definition is defined at github.com/arun-gupta/kubernetes-java-sample/blob/master/service-discovery.yml. It consists of:

  • A Couchbase service
  • Couchbase replica set with a single pod
  • A WildFly replica set with a single pod
The key part is where the value of the COUCHBASE_URI environment variable is name of the Couchbase service. This allows the application deployed in WildFly to dynamically discovery the service and communicate with the database.

arungupta/couchbase:travel Docker image is created using github.com/arun-gupta/couchbase-javaee/blob/master/couchbase/Dockerfile.

arungupta/wildfly-couchbase-javaee:travel Docker image is created using github.com/arun-gupta/couchbase-javaee/blob/master/Dockerfile.

Java EE application waits for database initialization to be complete before it starts querying the database. This can be seen at github.com/arun-gupta/couchbase-javaee/blob/master/src/main/java/org/couchbase/sample/javaee/Database.java#L25.

Deploy Application

This application can be deployed as:

The list of service and replica set can be shown using the command kubectl get svc,rs:

Logs for the single replica of Couchbase can be obtained using the command kubectl logs rs/couchbase-rs:

Logs for the WildFly replica set can be seen using the command kubectl logs rs/wildfly-rs:

Access Application

The kubectl proxy command starts a proxy to the Kubernetes API server. Let’s start a Kubernetes proxy to access our application:

Expose the WildFly replica set as a service using:

The list of services can be seen again using kubectl get svc command:

Now, the application is accessible at:

A formatted output looks like:

Now, new pods may be added as part of Couchbase service by scaling the replica set. Existing pods may be terminated or get rescheduled. But the Java EE application will continue to access the database service using the logical name.

This blog showed how a simple Java application can talk to a database using service discovery in Kubernetes.

For further information check out:

  • Kubernetes Docs
  • Couchbase on Containers
  • Couchbase Developer Portal
  • Ask questions on Couchbase Forums or Stack Overflow
  • Download Couchbase

Service Discovery with Java and Database application in DC/OS

This blog will show how a simple Java application can talk to a database using service discovery in DC/OS.

DC/OS logo

Why Service Discovery?

An application typically consist of multiple components such as an application server, a database, a web server, caching and messaging server. Typically, multiple replicas of each component would run based upon the needs of your application. Deploying this application using a container orchestration framework means that each replica would run as a container. So, an application is typically deployed as multi-container application.

Each container is assigned a unique IP address for its lifetime. But containers are ephemeral and may terminate and rescheduled on a different host by the orchestration framework. A container is typically assigned a different IP address in that case. This means an application deployed in application server cannot rely upon the IP address of the database. This is where service discovery is required.

So, multiple replicas of a component are assigned a logical name. For example, web for all the application server containers and db for all the database containers. Now, an application can talk to the database containers using the logical service name. This allows the database containers to be rescheduled anywhere in the cluster, and also scale up and down dynamically.

Let’s see how this can be accomplished in DC/OS with a single instance of application server and database server. This blog will use WildFly for application server and Couchbase for database.

Couchbase Cluster on Mesos with DC/OS provide more details on how to setup a Couchbase cluster on DC/OS.

This blog will use the following main steps:

  • Setup DC/OS Cluster
  • Marathon application definition
  • Deploy the application

The complete source code used in this blog is at github.com/arun-gupta/dcos-java-database.

Many thanks to @unterstein for creating the Maven plugin and helping me understand the inner workings of DC/OS.

Setup DC/OS Cluster

DC/OS cluster can be easily created using the CloudFormation template. Detailed instructions, including system requirements and screenshots and setup, are available at Installing DC/OS on AWS.

CloudFormation output looks as shown:

DC/OS Cluster CloudFormation Output

Note down the value shown for the keys DnsAddress and PublicSlaveDnsAddress. The value of the first key can be used to access DC/OS GUI and looks like:

DC/OS Cluster Console Default Output

Configure DC/OS CLI as explained in CLI. In short, the following commands are used:

  • dcos config set core.dcos_url http://${DnsAddress} Replace ${DnsAddress} with the corresponding value from the CloudFormation output.
  • dcos auth login
  • dcos config show core.dcos_acs_token. If not already done, clone the repo from github.com/arun-gupta/dcos-java-database. Create a new file.dcos-token and copy the output from the command in this file.
  • dcos package install marathon-lb

Marathon Application Definition

Marathon framework is used to schedule containers in DC/OS. A marathon application can be defined by providing an application definition.

As mentioned earlier, this blog will show how a simple Java application can talk to a database. We’ll use a Java EE application deployed in WildFly and use Couchbase as the database. The application definition looks like:

What are the key points in this application definition?

  • Application has two containers: database and web. The web container has a dependency on the database container defined using dependencies attribute.
  • database container uses arungupta/couchbase:travel Docker image. This image is created from github.com/arun-gupta/couchbase-javaee/tree/master/couchbase. It uses Couchbase base image and uses Couchbase REST API to pre-configure the database. A sample bucket is also loaded in the database as well.
  • web container uses arungupta/wildfly-couchbase-javaee:travel image. This image is created from github.com/arun-gupta/couchbase-javaee/blob/master/Dockerfile. This is a Java EE 7 application bundled in WildFly. The app uses COUCHBASE_URI as an environment variable to connect to the Couchbase database. The value of this environment variable is configured to use DNS service discovery and is derived as explained in Virtual Networks.

Make sure to change the value of HAPROXY_0_VHOST to match the value of ${PublicSlaveDnsAddress} from CloudFormation output. The label HAPROXY_0_VHOST instructs Marathon-LB to expose the Docker container, the WildFly application server in our case, on the external load balancer with a virtual host. The 0 in the label key corresponds to the servicePort index, beginning from 0. If you had multiple servicePort definitions, you would iterate them as 0, 1, 2, and so on. Deploying an internally and externally load-balanced app with marathon-lb provide more details about how to configure marathon-lb.

Service Discovery and Load Balancing provide more details about service discovery and load balancing in DC/OS.

Deploy the Application using Maven

The application can be deployed using dcos-maven-plugin.

Plugin looks like:

Main points in this fragment are:

  • Plugin version is 0.2. That indicates the plugin is still in early stages of development.
  • dcosUrl is the value of ${DnsAddress} key from CloudFormation output. This address is used for deployment of the application.
  • <deployable> element enables different types of deployment – app, group or pods. This element is a hint for the plugin and should likely go away in a future version as Marathon API consolidates. Follow #11 for more details.

Other details and configuration about the plugin are at dcos-maven-plugin.

Deploy the application:

The following output is shown:

Here are some of the updated output from DC/OS console.

First updated Services tab:
DC/OS Cluster Web Application

Two applications in the service:
DC/OS Cluster Web Application

Database application has one task:
DC/OS Cluster Web Application

Status of database task:Database Service Discovery

Logs from the database task:
DC/OS Cluster Web Application

It shows the output from Couchbase REST API for configuring the server.

Status of web task:
DC/OS Cluster Web Application

Logs from web task:
DC/OS Cluster WildFly Output

It shows that the Java EE application is deployed successfully.

Access the application:

The address is the value of the key ${PublicSlaveDnsAddress} from CloudFormation output. A formatted output, for example with jq, looks like:

That’s it!

As mentioned earlier, the complete source code used in this blog is at github.com/arun-gupta/dcos-java-database.

This blog showed how a simple Java application can talk to a database using service discovery in DC/OS.

For further information check out:

  • DC/OS Docs
  • Couchbase on Containers
  • Couchbase Developer Portal
  • Ask questions on Couchbase Forums or Stack Overflow
  • Download Couchbase

Source: blog.couchbase.com/service-discovery-java-database-dcos/

Stateful Containers using Portworx and Couchbase

Portworx Logo Couchbase Logo

Containers are meant to be ephemeral and so scale pretty well for stateless applications. Stateful containers, such as Couchbase, need to be treated differently. Managing Persistence for Docker Containers provide a great overview of how to manage persistence for stateful containers.

This blog will explain how to use Docker Volume Plugins and Portworx to create a stateful container.

Why Portworx?

Portworx is an easy-to-deploy container data services that provide persistence, replication, snapshots, encryption, secure RBAC and much more. Some of the benefits are:

  1. Container granular volumes – Portworx can take multiple EBS volumes per host and aggregate the capacity and derive container granular virtual (soft) volumes per container.
  2. Cross Availability Zone HA – Portworx will protect the data, at block level, across multiple compute instances across availability zones. As replication controllers restart pods on different nodes, the data will still be highly available on those nodes.
  3. Support for enterprise data operations – Portworx implements container granular snapshots, class of service, tiering on top of the available physical volumes.
  4. Ease of deployment and provisioning – Portworx itself is deployed as a container and integrated with the orchestration tools. DevOps can programmatically provision container granular storage with any property such as size, class of service, encryption key etc.

Setup AWS EC2 Instance

Portworx runs only on Linux or CoreOS. Setup an Ubuntu instance on AWS EC2:

  1. Start Ubuntu 14.04 instance with m3.medium instance type. Make sure to add port 8091 to inbound security rules. This allows Couchbase Web Console to be accessible afterwards.
  2. Login to the EC2 instance using the command: ssh -i ~/.ssh/arun-cb-west1.pem ubuntu@<public-ip>
  3. Update the Ubuntu instance: sudo apt-get update
  4. Install Docker: curl -sSL https://get.docker.com/ | sh. More detailed instructions are available at Get Docker for Ubuntu.
  5. Enable non-root access for the docker command: sudo usermod -aG docker ubuntu
  6. Logout from the EC2 instance and log back in

Create AWS EBS Volume

  1. Create an EBS volume for 10GB using EC2 console as explained in docs.
  2. Get the instance id from the EC2 console. Attach this volume to EC2 instance using this instance id, use the default device name /dev/sdf.
    Portworx EC2 Create Volume
  3. Use lsblk command in EC2 instance to verify that the volume is attached to the instance:

Portworx Container

  1. Physical storage makeup of each node, all the provisioned volumes in the cluster as well as their container mappings is stored in an etcd cluster. Start an etcd cluster:
  2. By default root mounted volumes are not allowed to be shared. Enable this using the command:
    This is explained more at Ubuntu Configuration and Shared Mounts.
  3. PX-Developer (px-dev) container on a server with Docker Engine turns that server into a scale-out storage node. PX-Enterprise, on the other hand, provides multi-cluster and multi-cloud support, where storage under management can be on-premise or in a public cloud like AWS.
    For this blog, we’ll start a px-dev container:
    Complete details about this command are available at Run PX with Docker.
  4. Look for logs using docker container logs -f px and watch out for the following statements:
  5. Check the status of attached volumes that are available to Portworx using sudo /opt/pwx/bin/pxctl status to see the output:
    It shows the total capacity available and used.

Docker Volume

  1. Let’s create a Docker volume:
    More details about this command are at Create Volumes with Docker.
  2. Check the list of volumes available using docker volume ls command:
    As shown, cbvol is created with pxd driver.

Couchbase with Portworx Volume

  1. Create a Couchbase container using the Portworx volume:
    Notice how /opt/couchbase/var where all Couchbase data is stored in the container is mapped to the cbvol volume on the host. This volume is mapped by Portworx.
  2. Login to Couchbase Web Console at http://<public-ip>:8091, use the login Administrator and password as password.
  3. Go to Data Buckets and create a new data bucket pwx:
    Couchbase Bucket with Portworx
  4. In EC2 instance, see the list of containers:
    etcd, px-dev and db containers are running.
  5. Kill the db container:
  6. Restart the database container as:
    Now, because cbvol is mapped to /opt/couchbase/var again, the data is preserved across restarts. This can be verified by accessing the Couchbase Web Consoleand checking on the pwx bucket created earlier.

Another interesting perspective is also at why database are not for containers?. Just because there is Docker, does not mean all your database needs should be Dockerized. But if you need to, then there are plenty of options and can be used in production-grade applications.

Want to learn more about running Couchbase in containers?

  • Couchbase on Containers
  • Couchbase Developer Portal
  • @couchhasedev and @couchbase

Source: blog.couchbase.com/stateful-docker-containers-portworx-couchbase/

Start Couchbase Using Docker Compose

Couchbase Forums has a question Can’t use N1QL on docker-compose. This blog will show how to run Couchbase using Docker Compose and run a N1QL query.

Docker ComposeN1QL

What is Docker Compose?

Docker Compose allows you to define your multi-container application with all of its dependencies in a single file, then spin your application up in a single command.

Docker Compose introduced v3 in Docker 1.13. How do you know what version of Docker are you running?

docker version command gives you that information:

Couchbase Docker Compose File

Now if you see this version of Docker, then you can use the following Compose file:

In this Compose file:

  • v3 version of Compose file. If you are using an older version of Docker, then you can consider using v2 version of Compose file.
  • arungupta/couchbase Docker image is used to start Couchbase server.  This image is created as explained at github.com/arun-gupta/docker-images/tree/master/couchbase. It uses Couchbase REST API to pre-configure the Couchbase server.
  • Ports 8091, 8092, 8093, 8094, 11210 are exposed.
  • Only a single replica of Couchbase server is started.

Couchbase can be started in a couple of ways using this Compose file.

Couchbase using Docker Compose on Single Docker Host

If you want to start Couchbase on a single host (such as provisioned by Docker for Mac or a single Docker Machine), then use the command:

This will show the warning message but starts Couchbase server:

Check the status of started service using the command docker-compose ps:

All the exposed ports are shown and Couchbase is accessible at http://localhost:8091. Use the credentials Administrator/password to access the web console.

Now you can create buckets and connect from CBQ and run N1QL queries. For example:

Typically, you may be able to scale the services started by Docker Compose using docker-compose scale command. But this will not be possible in our case as the ports are exposed. Scaling a service will cause port conflict.

The container can be brought down using the command docker-compose down.

Couchbase using Docker Compose on Multi-host Swarm-mode Cluster

Docker allows multiple hosts to be configured in a cluster using Swarm-mode. This can be configured using the command docker swarm init.

Once the cluster is initialized, then the Compose file can be used to start the cluster:

It shows the output:

This creates a Docker service and the status can be seen using the command docker service ls:

Check the tasks/containers running inside the service using the command docker service ps couchbase_db:

Here again, you can connect to the Couchbase server and run N1QL queries:

The service, and thus the container running in the service, can be terminated using the command docker service couchbase_db.

Any more questions? Catch us on Couchbase Forums.

You may also consider running Couchbase Cluster using Docker or read more about Deploying Docker Services to Swarm.

Want to learn more about running Couchbase in containers?

  • Couchbase on Containers
  • Couchbase Developer Portal
  • @couchhasedev and @couchbase

Source: blog.couchbase.com/couchbase-using-docker-compose/

Getting Started with Oracle Container Cloud Service

Oracle Cloud Container Logo

Oracle Container Cloud Service is Oracle’s entry into the the world of managed container service. There are plenty of existing options:

  • Docker for AWS or Azure
  • Amazon Elastic Container Service
  • Google Container Engine
  • Azure Container Service
  • DC/OS by Mesosphere
  • OpenShift by Red Hat

This blog will explain how to get started with Oracle Container Cloud Service. A comparison of different managed services is started at Managed Container Service.

Before we jump into all the details, let’s try to clarify a couple of things about this offering from Oracle.

First, a bit about the name. “Oracle Cloud Container Service” seems more natural and intuitive since its a Container Service in Oracle Cloud. Wonder why is it called “Oracle Container Cloud Service”? Is it because “Oracle Container” is Oracle’s container orchestration framework and its a Cloud Service? Could that mean other orchestration frameworks be offered as a service as well?

Second, don’t confuse it with Oracle Application Container Cloud Service that allows to build cloud-native 12-factor applications using polyglot platform. Now, that confuses me further. Can the Container Service not be used to build 12-factor apps? Are cloud-native and containers mutually exclusive?

Anyway, this is causing more confusion than clarification :) Let’s move on!

One last thing before we dig in. Many thanks to Bruno Borges (@brunoborges) for pushing the buttons for cloud service activation. I don’t know the normal time for the free trial to be activated otherwise. And a much bigger thank to Mike Raab (@mikeraab) for helping me understand the details of Container Service.

Let’s get started!

  1. Get a Free Trial for Oracle Cloud. It takes a few days for the trial to be activated. The trial time bombs after 30 days so make sure you’ve time planned for evaluation. Each free trial comes with 6 OC3 nodes. OC3 is one of the compute node types available on Oracle Cloud. OC3 particularly is 1 OCPU (think vCPU on Amazon Web Services) and 7.5 GB RAM.
  2. Once the account is activated, you get an email as shown:oracle-cloud-welcome-emailThe important piece of information is username, temporary password, identity domain and My Services URL. The My Account URL link is only for account administration.
  3. Click on My Service URL, login using the values from email:oracle-cloud-services-login
    You get an opportunity to change your password afterwards
  4. Oracle Cloud dashboard shows up after logging in:oracle-cloud-services-dashboardA default set of services and their status is shown. The dashboard can also be customized by clicking on Customize Dashboard button on the top right.
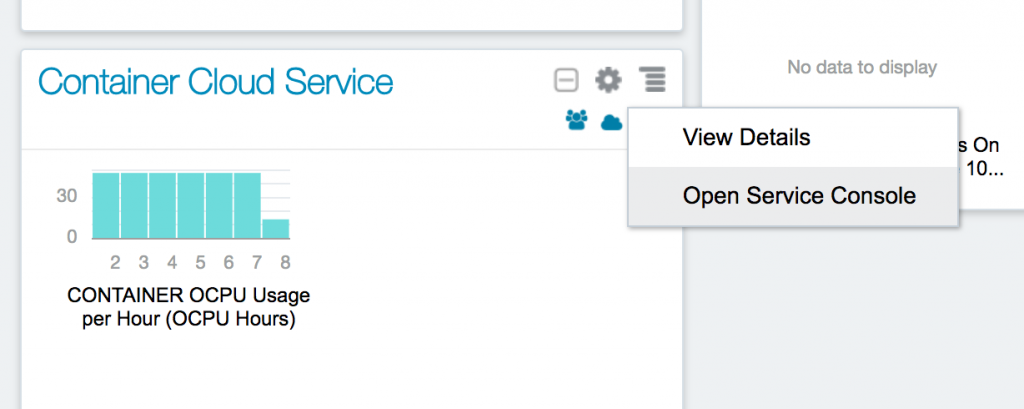
  5. Getting to Oracle Container Cloud Service Console is a bit non-intuitive but you get it once you know it. Select Container Cloud Service tab, click on top-right corner and select Open Service Console:oracle-cloud-container-service-console-accessOr you can directly click on the link for Oracle Container Cloud Service Console in the welcome email. Service console looks like:oracle-cloud-container-service-console
  6. Click on Create Service:oracle-cloud-container-service-definitionOracle Container Container Service Instance Details provide more details about each of the field.What is a worker node? We’ll talk about it a bit later. But essentially this is where the container runs. We are asking for only one worker node.

    Its worth noting different capacities for the worker node:
    Oracle Cloud CPUs

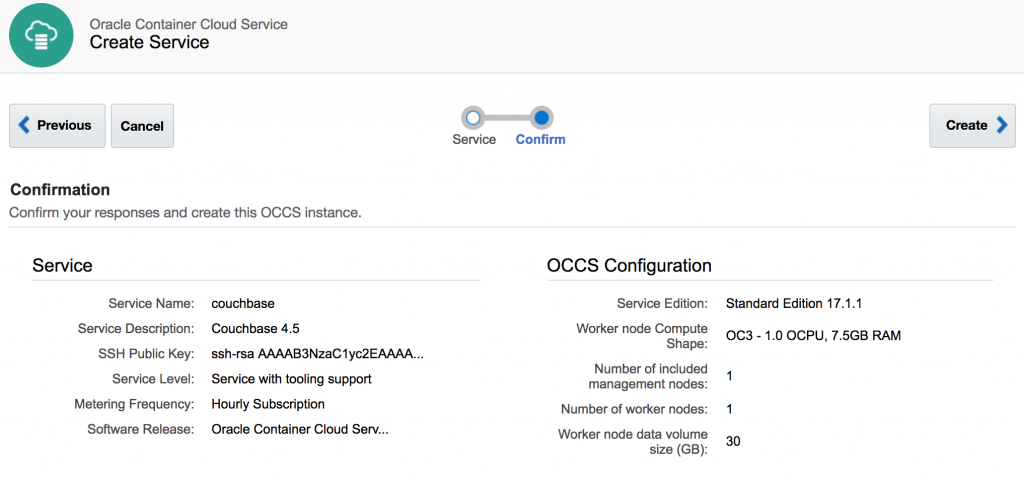
    Confirm all the settings:

    oracle-cloud-container-service-definition-confirmation

    and click on Create> to start the service creation.

  7. Wait for about 30 minutes for the service to be created. After that the Service Console looks like:
    oracle-cloud-container-service-console-with-serviceWait, we asked for  one worker node and how come two OCPUs are being consumed.Each Oracle Container Cloud Service has at least two nodes – a manager node and one or more worker nodes. Manager node is responsible for administration of all the workers and and orchestrate containers on different worker nodes. Worker nodes can be organized in different resource pools to meet different workflow needs.

    And, so ~30 minutes are spent provisioning two nodes and installing container service components on each node. This is also evident in the service logs shown in Service Create and Delete History shown in the main Console page:

    No timestamp in the activity feels a bit too clean.

  8. One main question that I kept wondering all along is “when am I ready to deploy the containers?“. Apparently, not yet!A couple of more steps so hang in there …

    In your service, click on the top-right icon to select another menu:
    oracle-cloud-container-console-open

    Select Container Console.  So, now you are transitioning from Oracle Container Cloud Service Console to Container Console. Make sure to use the right terminology otherwise it gets confusing fast.

  9. This attempts to open Container Console but prompts the usual warningoracle-cloud-container-console-open-warning

    Just click on Proceed link. In a typical production setup, this will setup correctly using certificates and so this warning would not happen.

  10. This brings up a login screen:oracle-cloud-container-console-login
  11. Use the username and password specified during service creation earlier. Click on Login to see Container Console:oracle-cloud-container-console-default

Are we there yet?

Yes, now is the time to deploy containers. But we’ll cover that in a subsequent blog!

Just to recap on what is needed to get started with Oracle Container Cloud Service …

  1. Register for Oracle Cloud trial
  2. Login to main Oracle Cloud Dashboard
  3. Create a Oracle Container Cloud Service Instance
  4. Oracle Container Cloud Service Instance Console
  5. Container Console

All the steps need to be done once but a console inside a console inside a dashboard feels like Inception. The good thing is that the IP address of Container Console is a public IP address served by Oracle Cloud and can be used from anywhere.

Oracle Container Cloud Service Docs have lot more details about building and deploying applications using this Console.

In the next blog, we’ll see what it takes to run a Couchbase container using this console? Possibly a cluster of Couchbase across multiple hosts?

Want to learn more about running Couchbase in containers?

  • Couchbase on Containers
  • Couchbase Forums
  • Couchbase Developer Portal
  • @couchhasedev and @couchbase

Source: https://blog.couchbase.com/2017/february/getting-started-oracle-container-cloud-service

Microservice using Docker stack deploy – WildFly, Java EE and Couchbase

There is plenty of material on microservices, just google it! I gave a presentation on refactoring monolith to microservices at Devoxx Belgium a couple of years back and it has good reviews:

This blog will show how Docker simplifies creation and shutting down of a microservice.

All code used in this blog is at github.com/arun-gupta/couchbase-javaee.

Microservice Definition using Compose

Docker 1.13 introduced a v3 of Docker Compose. The changes in the syntax are minimal but the key difference is addition of deploy attribute. This attribute allows to specify replicas, rolling update and restart policy for the container.

Our microservice will start a WldFly application server with a Java EE application pre-deployed. This application will talk to a Couchbase database to CRUD application data.

Here is the Compose definition:

In this Compose file:

  1. Two services in this Compose are defined by the name db and web attributes
  2. Image name for each service defined using image attribute
  3. The arungupta/couchbase:travel image starts Couchbase server, configures it using Couchbase REST API, and loads travel-sample bucket with ~32k JSON documents.
  4. The arungupta/couchbase-javaee:travel image starts WildFly and deploys application WAR file built from https://github.com/arun-gupta/couchbase-javaee. Clone that project if you want to build your own image.
  5. envrionment attribute defines environment variables accessible by the application deployed in WildFly. COUCHBASE_URI refers to the database service. This is used in the application code as shown at https://github.com/arun-gupta/couchbase-javaee/blob/master/src/main/java/org/couchbase/sample/javaee/Database.java.
  6. Port forwarding is achieved using ports attribute
  7. depends_on attribute in Compose definition file ensures the container start up order. But application-level start up needs to be ensured by the applications running inside container. In our case, WildFly starts up rather quickly but takes a few seconds for the database to start up. This means the Java EE application deployed in WildFly is not able to communicate with the database. This outlines a best practice when building micro services applications: you must code defensively and ensure in your application initialization that the micro services you depend on have started, without assuming startup order. This is shown in the database initialization code at https://github.com/arun-gupta/couchbase-javaee/blob/master/src/main/java/org/couchbase/sample/javaee/Database.java. It performs the following checks:

    1. Bucket exists
    2. Query service of Couchbase is up and running
    3. Sample bucket is fully loaded

This application can be started using docker-compose up -d command on a single host. Or a cluster of Docker engines in swarm-mode using docker stack deploy command.

Setup Docker Swarm-mode

Initialize Swarm mode using the following command:

This starts a Swarm Manager. By default, manager node are also worker but can be configured to be manager-only.

Find some information about this one-node cluster using the command docker info command:

This cluster has 1 node, and that is manager.

Alternatively, a multi-host cluster can be easily setup using Docker for AWS.

Deploy Microservice

The microservice can be started as:

This shows the output:

WildFly and Couchbase services are started on this node. Each service has a single container. If the Swarm mode is enabled on multiple nodes then the containers will be distributed across multiple nodes.

A new overlay network is created. This allows multiple containers on different hosts to communicate with each other.

Verify that the WildFly and Couchbase services are running using docker service ls:

Logs for the service can be seen using docker service logs -f webapp_web:

Make sure to wait for the last log statement to show.

Access Microservice

Get 10 airlines from the microservice:

This shows the results as:

Docker for Java Developers workshop is a self-paced hands-on lab and allows you to get started with Docker easily.

Get a single resource:

Create a new resource:

Update a resource:

Delete a resource:

Detailed output from each of these commands is at github.com/arun-gupta/couchbase-javaee.

Delete Microservice

The microservice can be removed using  the command docker stack rm webapp:

Want to get started with Couchbase? Look at Couchbase Starter Kits.

Want to learn more about running Couchbase in containers?

  • Couchbase on Containers
  • Couchbase Forums
  • Couchbase Developer Portal
  • @couchhasedev and @couchbase

Source: https://blog.couchbase.com/2017/february/microservice-using-docker-stack-deploy-wildfly-javaee-couchbase

Deploy Docker Compose Services to Swarm

Docker 1.13 introduced a new version of Docker Compose. The main feature of this release is that it allow services defined using Docker Compose files to be directly deployed to Docker Engine enabled with Swarm mode. This enables simplified deployment of multi-container application on multi-host.

Docker 1.13

This blog will show use a simple Docker Compose file to show how services are created and deployed in Docker 1.13.

Here is a Docker Compose v2 definition for starting a Couchbase database node:

This definition can be started on a Docker Engine without Swarm mode as:

This will start a single replica of the service define in the Compose file. This service can be scaled as:

If the ports are not exposed then this would work fine on a single host. If swarm mode is enabled on on Docker Engine, then it shows the message:

Docker Compose gives us multi-container applications but the applications are still restricted to a single host. And that is a single point of failure.

Swarm mode allows to create a cluster of Docker Engines. With 1.13, docker stack deploy command can be used to deploy a Compose file to Swarm mode.

Here is a Docker Compose v3 definition:

As you can see, the only change is the value of version attribute. There are other changes in Docker Compose v3. Also, read about different Docker Compose versions and how to upgrade from v2 to v3.

Enable swarm mode:

Other nodes can join this swarm cluster and this would easily allow to deploy the multi-container application to a multi-host as well.

Deploy the services defined in Compose file as:

A default value of Compose file here would make the command a bit shorter. #30352 should take care of that.

List of services running can be verified using docker service ls command:

The list of containers running within the service can be seen using docker service ps command:

In this case, a single container is running as part of the service. The node is listed as moby which is the default name of Docker Engine running using Docker for Mac.

The service can now be scaled as:

The list of container can then be seen again as:

Note that the containers are given the name using the format <service-name>_n. Both the containers are running on the same host.

Also note, the two containers are independent Couchbase nodes and are not configured in a cluster yet. This has already been explained at Couchbase Cluster using Docker and a refresh of the steps is coming soon.

A service will typically have multiple containers running spread across multiple hosts. Docker 1.13 introduces a new command docker service logs <service-name> to stream the log of service across all the containers on all hosts to your console. In our case, this can be seen using the command docker service logs couchbase_db and looks like:

The preamble of the log statement uses the format <container-name>.<container-id>@<host>. And then actual log message from your container shows up.

At first instance, attaching container id may seem redundant. But Docker services are self-healing. This means that if a container dies then the Docker Engine will start another container to ensure the specified number of replicas at a given time. This new container will have a new id. And thus it allows  to attach the log message from the right container.

So a quick comparison of commands:

 Docker Compose v2  Docker compose v3
 Start services docker-compose up -d docker stack deploy --compose-file=docker-compose.yml <stack-name> 
 Scale service docker-compose scale <service>=<replicas> docker service scale <service>=<replicas>
 Shutdown docker-compose down docker stack rm <stack-name>
 Multi-host No Yes

Want to get started with Couchbase? Look at Couchbase Starter Kits.

Want to learn more about running Couchbase in containers?

  • Couchbase on Containers
  • Couchbase Forums
  • Couchbase Developer Portal
  • @couchhasedev and @couchbase

Source: https://blog.couchbase.com/2017/deploy-docker-compose-services-swarm

Docker 1.13 Management Commands

Docker 1.13 was released yesterday, congratulations!

Docker 1.13

A quick summary of the key features:

  • Compose file to deploy Swarm mode services
  • Improved CLI backwards compatibility
  • Clean-up commands
  • CLI restructured
  • Monitoring and Build improvements

Learn more details about these features in this video by @manomarks:

Getting Started with Docker 1.13

Use Docker for Mac or Windows to get started. Once installed, the version information looks like:

Problems with Docker CLI

Docker 1.12 CLI has about ~40 top-level solo commands. While these commands wokred very well but they had a few issues:

  1. The commands are listed in one list without any organization. That makes it difficult for newbies to get started and learn the commands. (#8756)
  2. The command, such as docker inspect, also does not provide enough context whether they are operating on image or container. This mixing of image and container commands can cause confusion. (#13509)
  3. There is no consistency of command names. For example docker images is a plural and gives the list of images where as docker ps is singular and gives the list of containers. And they of course have the naming inconsistency issue. (#8829)
  4. Some of the commands like build and run are used heavily and then some arcane ones like pause and wait not so often. It does not seem fair to keep all the commands at the same level.

Docker 1.13 fixes this problem!

Docker Management Commands

Docker 1.13 groups the commands logically into management commands.

Here are the top-level solo commands now:

Now a list of images is obtained using docker image ls command instead of docker images command. Similar docker container ls shows the list of containers instead of docker ls. This brings a lot of consistency across the commands and that would make it intuitive and easier for newbie and pros to remember the commands.

Each management command has some similar set of sub-commands where they perform the operation on the command category:

Sub-command Purpose
ls List <category> (image, container, volume, secret, etc)
rm Remove <category>
inspect Inspect <category>

And there are other sub-commands based upon the management category.

Some of the heavily used commands are still at the top level.

By default, all the top-level commands are also shown. But you can set the DOCKER_HIDE_LEGACY_COMMANDS environment variable to show only the management commands. So even though docker --help will show all the solo and management commands. But the following commands will only show the new management commands:

The old syntax is still supported but it recommended to start moving to new commands.

A new Couchbase container can be started as:

The list of images can be seen as:

Mapping Docker Solo to Management Commands

Let’s look at how the existing top-level commands match to the management commands:

1.12 1.13 Purpose
attach container attach Attach to a running container
build image build Build an image from a Dockerfile
commit container commit Create a new image from a container’s changes
cp container cp Copy files/folders between a container and the local filesystem
create container create Create a new container
diff container diff Inspect changes on a container’s filesystem
events system events Get real time events from the server
exec container exec Run a command in a running container
export container export Export a container’s filesystem as a tar archive
history image history Show the history of an image
images image ls List images
import image import Import the contents from a tarball to create a filesystem image
info system info Display system-wide information
inspect container inspect Return low-level information on a container, image or task
kill container kill Kill one or more running containers
load image load Load an image from a tar archive or STDIN
login login Log in to a Docker registry.
logout logout Log out from a Docker registry.
logs container logs Fetch the logs of a container
network network Manage Docker networks
node node Manage Docker Swarm nodes
pause container pause Pause all processes within one or more containers
port container port List port mappings or a specific mapping for the container
ps container ls List containers
pull image pull Pull an image or a repository from a registry
push image push Push an image or a repository to a registry
rename container rename Rename a container
restart container restart Restart a container
rm container rm Remove one or more containers
rmi image rm Remove one or more images
run container run Run a command in a new container
save image save Save one or more images to a tar archive (streamed to STDOUT by default)
search search Search the Docker Hub for images
service service Manage Docker services
start container start Start one or more stopped containers
stats container stats Display a live stream of container(s) resource usage statistics
stop container stop Stop one or more running containers
swarm swarm Manage Docker Swarm
tag image tag Tag an image into a repository
top container top Display the running processes of a container
unpause container unpause Unpause all processes within one or more containers
update container update Update configuration of one or more containers
version version Show the Docker version information
volume volume Manage Docker volumes
wait container wait Block until a container stops, then print its exit code

Sign up for Docker Online Meetup on 1/25 at 10am PST for more details on Docker 1.13.

Use Docker for Mac or Windows to get started with Docker 1.13.

And of course, you can learn more about how to run Couchbase on Containers.

Source: https://blog.couchbase.com/2017/docker-1-13-management-commands

Starting a Kubernetes 1.5.x cluster

Kubernetes

Kubernetes 1.5.0 was released just about a month ago! Key theme for the release are:

  • StatefulSets (ex-PetSets)
    • StatefulSets are beta now (fixes and stabilization)
  • Improved Federation Support
    • New command: kubefed
    • DaemonSets
    • Deployments
    • ConfigMaps
  • Simplified Cluster Deployment
    • Improvements to kubeadm
    • HA Setup for Master
  • Node Robustness and Extensibility
    • Windows Server Container support
    • CRI for pluggable container runtimes
    • kubelet API supports authentication and authorization

Read CHANGELOG for complete details.

Up until 1.5.0, starting up a Kubernetes cluster on Amazon Web Services was pretty straight forward.

But with 1.5.0 and 1.5.1, the command fails with the error:

What happened?

Basically, Kubernetes binaries was getting bigger than 1GB. The binary was broken into a basic install bundle and client and server binaries. The updated installation process requires to download the basic install bundle of of 4.57 MB (yes, MB instead of GB). It includes cluster scripts like kubectl, kube-up.sh and kube-down.sh, examples, docs and other scripts. This then downloads client and server binaries. Server binary is the base image that is used to start EC2 instances. But instead of automating the download of binaries, somebody decided to add a README in the server directory.

This was a big user experience change, and no links in the README bundled with the release or the release blog. Ouch!

Anyway, this was filed as #38728 and fixed promptly. But it missed the 1.5.1 release and now finally showed up in the 1.5.2 release today.

So, how do you run a Kubernetes 1.5.2 cluster on AWS?

It is more seamlessly integrated now but you need to hit Enter key a couple of times to accept the default value:

After the usual Kubernetes cluster is created, the output is shown as:

Even though your Kubernetes cluster on AWS starts up fine, but kube-up.sh script is going to be deprecated soon. The recommended way is to use Kubernetes Cluster on Amazon using Kops.

Now that your Kubernetes cluster is up, what do you do next?

  • Follow the detailed steps for Kubernetes for Java Developers workshop.
  • Run a Couchbase cluster in Kubernetes
  • Learn more about Couchbase cluster in Containers

Source: https://blog.couchbase.com/2017/january/starting-kubernetes-1.5.x-cluster

Kubernetes Monitoring with Heapster, InfluxDB and Grafana

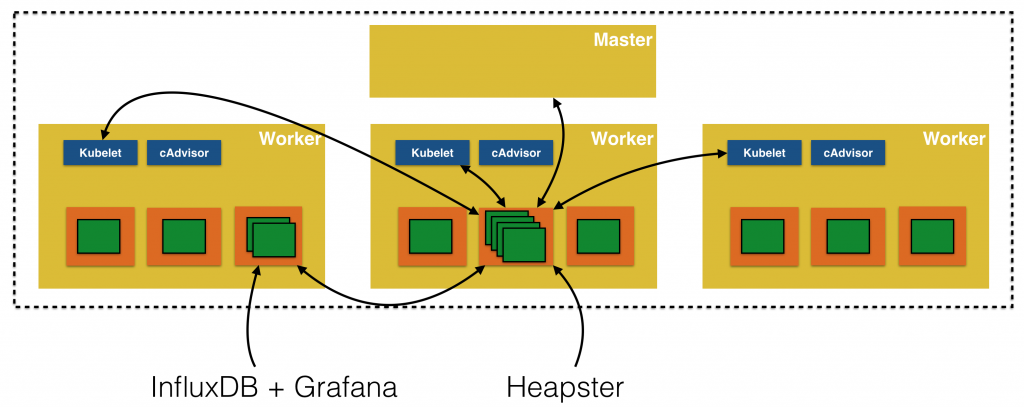
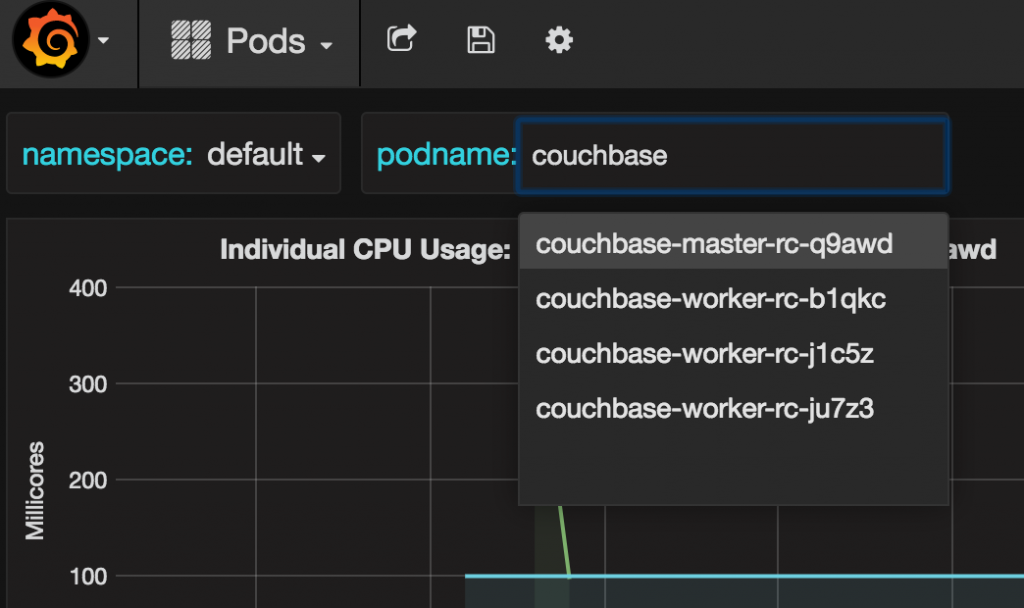
Kubernetes provides detailed insights about resource usage in the cluster. This is enabled by using Heapster, cAdvisor, InfluxDB and Grafana.

Heapster is installed as a cluster-wide pod. It gathers monitoring and events data for all pods on each node by talking to the Kubelet. Kubelet itself fetches this data from cAdvisor. This data is persisted in InfluxDB and then visualized using Grafana.

kubernetes-logging

Resource Usage Monitoring provide more details about monitoring resources in Kubernetes.

Heapster, InfluxDB and Grafana are Kubernetes addons. They are enabled by default if you are running the cluster on Amazon Web Services or Google Cloud. But need to be explicitly enabled if the cluster is started using minikube or kops addons.

Start a Kubernetes cluster on Amazon Web Services as:

KUBERNETES_PROVIDER=aws; kube-up.sh

More details about starting a Kubernetes cluster are available at Getting Started with Kubernetes 1.4.

By default, it creates a 4-node Kubernetes cluster in us-west-2a region. More details about the cluster can be seen using the command kubectl cluster-info and it shows the results as:

Note the URL for the Grafana service. Open this URL in a browser window. You’ll be prompted for an invalid certificate warning but this can be safely ignored at this time. In production system, appropriate certificates should be installed.

Then you’ll be prompted for credentials. These can be obtained using kubectl config view command. It will show the output as:

Use the value from username and password fields.

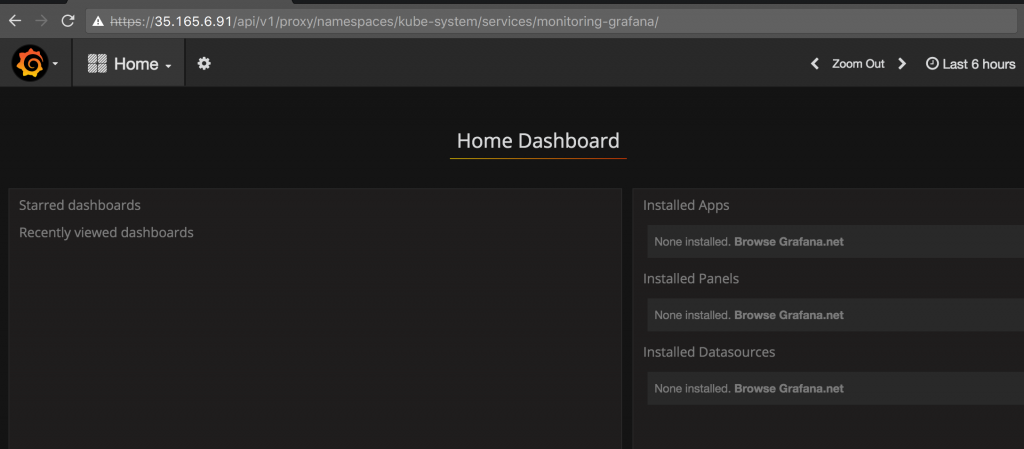
This shows the default dashboard:

kubernetes-grafana-empty-dashboard

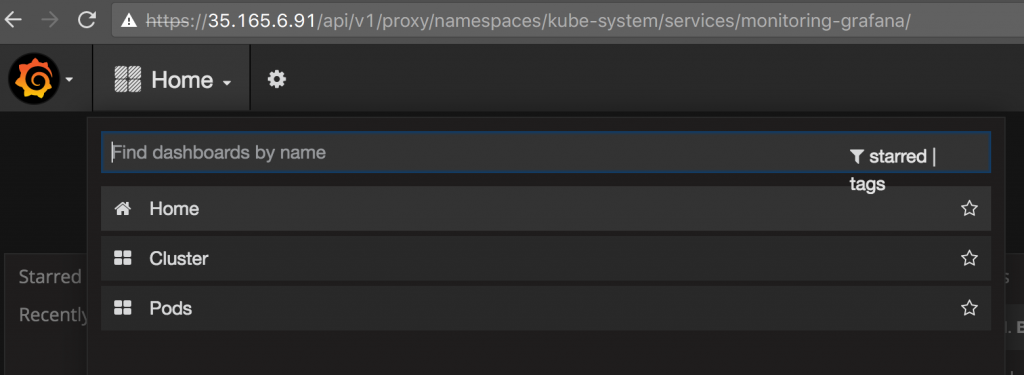
It consists of two dashboards – one for cluster and another for pods.

kubernetes-grafana-dashboards

For this blog, a 4-node Couchbase cluster was created following the steps outlined in Create a Couchbase Cluster using Kubernetes.

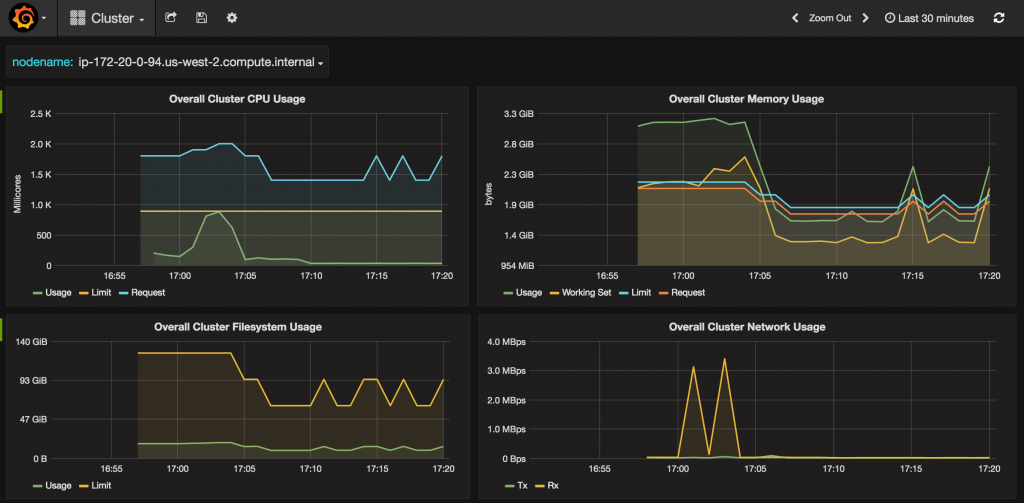
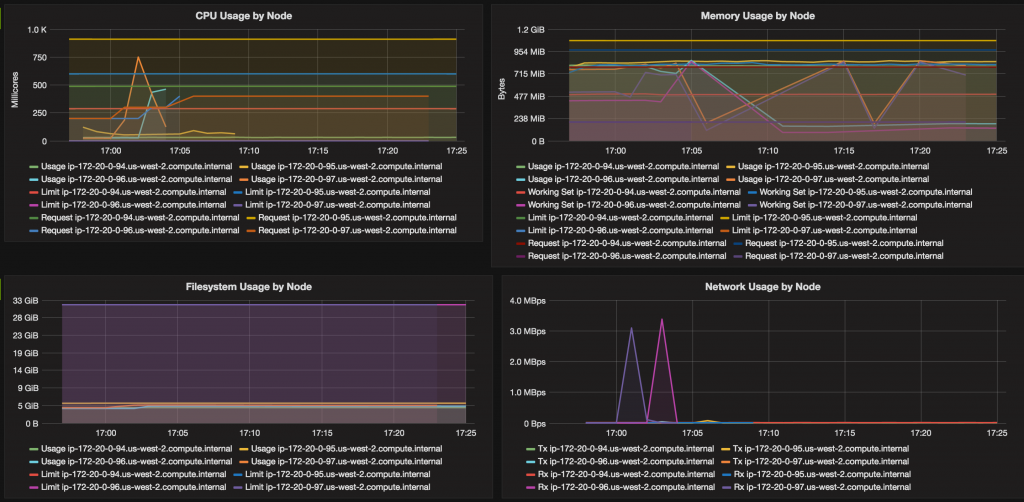
A cluster-wide dashboard shows CPU, Memory, Filesystem and Network usage across all the hosts and looks like:

kubernetes-grafana-cluster

CPU, memory, filesystem and network usage for all nodes may be seen:

kubernetes-grafana-cluster-per-node

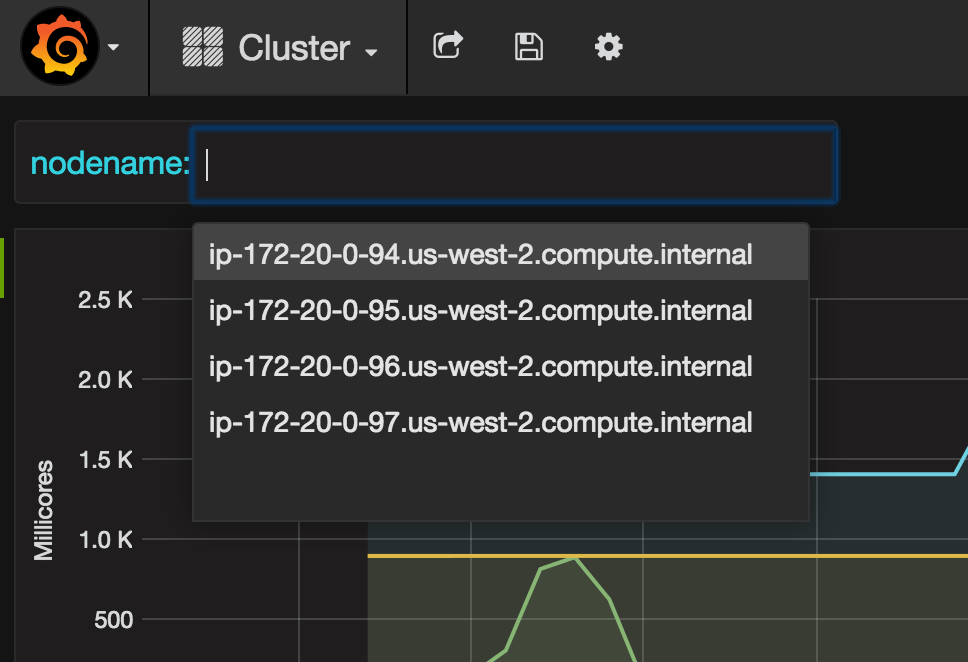
Details for each node may be seen by selecting the node:

kubernetes-grafana-cluster-nodelist

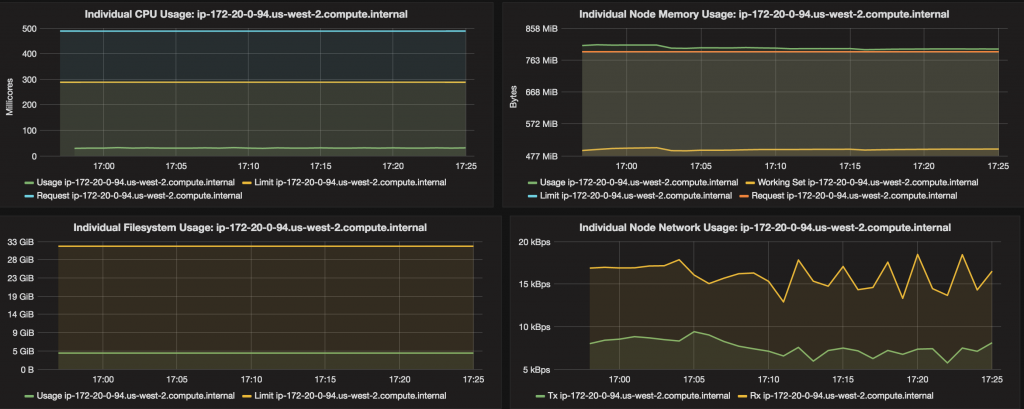
CPU, memory, filesystem and network usage for each node is displayed:

kubernetes-grafana-cluster-one-node

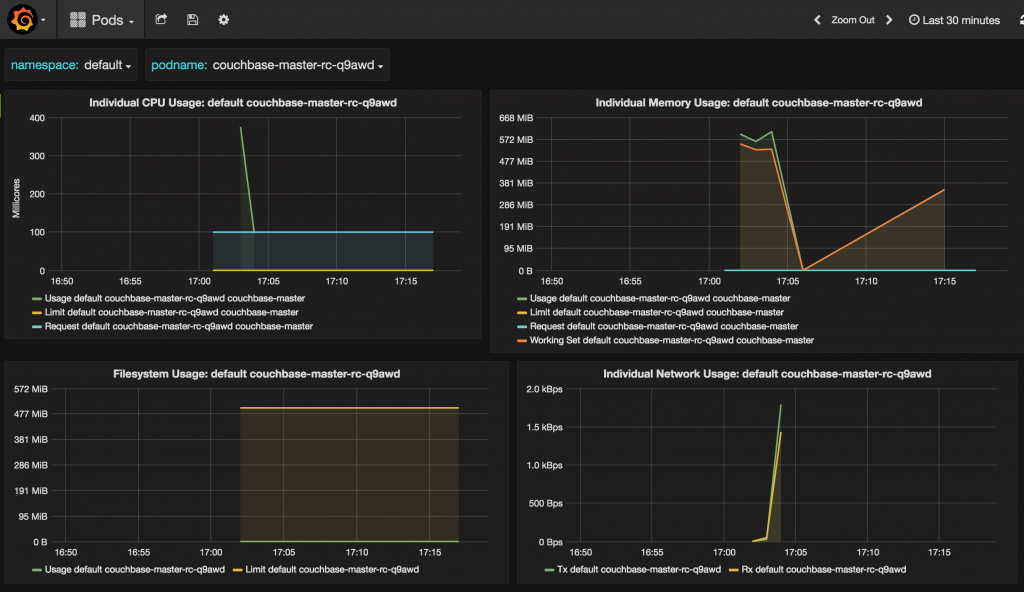
Pods dashboard shows CPU, memory, filesystem and network usage for each pod:

kubernetes-grafana-pods

A different pod may be chosen:

kubernetes-grafana-pods-list

A complete list of all services running in the Kubernetes can be seen using kubectl get services --all-namespaces command. It shows the output as:

A complete list of all the pods running in the Kubernetes cluster can be seen using kubectl get pods --all-namespaces. It shows the output as:

kubectl.sh get pods --all-namespaces
NAMESPACE NAME READY STATUS RESTARTS AGE
default couchbase-master-rc-q9awd 1/1 Running 17 56m
default couchbase-worker-rc-b1qkc 1/1 Running 15 54m
default couchbase-worker-rc-j1c5z 1/1 Running 17 52m
default couchbase-worker-rc-ju7z3 1/1 Running 15 52m
kube-system elasticsearch-logging-v1-18ylh 1/1 Running 0 1h
kube-system elasticsearch-logging-v1-fupap 1/1 Running 0 1h
kube-system fluentd-elasticsearch-ip-172-20-0-94.us-west-2.compute.internal 1/1 Running 0 1h
kube-system fluentd-elasticsearch-ip-172-20-0-95.us-west-2.compute.internal 1/1 Running 0 1h
kube-system fluentd-elasticsearch-ip-172-20-0-96.us-west-2.compute.internal 1/1 Running 15 1h
kube-system fluentd-elasticsearch-ip-172-20-0-97.us-west-2.compute.internal 1/1 Running 17 1h
kube-system heapster-v1.2.0-1374379659-jms8e 4/4 Running 0 1h
kube-system kibana-logging-v1-fcg4b 1/1 Running 3 1h
kube-system kube-dns-v20-wpip4 3/3 Running 0 1h
kube-system kube-proxy-ip-172-20-0-94.us-west-2.compute.internal 1/1 Running 0 1h
kube-system kube-proxy-ip-172-20-0-95.us-west-2.compute.internal 1/1 Running 0 1h
kube-system kube-proxy-ip-172-20-0-96.us-west-2.compute.internal 1/1 Running 15 1h
kube-system kube-proxy-ip-172-20-0-97.us-west-2.compute.internal 1/1 Running 17 1h
kube-system kubernetes-dashboard-v1.4.0-yxxgx 1/1 Running 0 1h
kube-system monitoring-influxdb-grafana-v4-7asy4 2/2 Running 0 1h

Some references:

  • Kubernetes Resource Monitoring
  • Couchbase Cluster using Kubernetes, Docker Swarm, DC/OS and Amazon ECS
  • Follow us @couchbasedev

Source: blog.couchbase.com/2016/december/kubernetes-monitoring-heapster-influxdb-grafana

Couchbase Cluster on Mesos with DC/OS

apache-mesos-logoapache-mesos-marathon-logoDocker LogoCouchbase Logo

Apache Mesos is an open source cluster manager developed at UC Berkeley. It provides resource isolation and sharing across distributed applications. Mesos consists of a master daemon that manages slave daemons running on each cluster node.Mesos frameworks are applications that runs on Mesos and run tasks on these slaves. Marathon is a container orchestration platform running on Mesos.Multiple container formats are supported and Docker is certainly the most common one!

Docker Container using Apache Mesos and Marathon explains how to setup Mesos and Marathon. The setup is quite involving and a bit flaky. It required to download and Install Mesos Master and Slave, ZooKeeper, Docker Engine, and Marathon.

DC/OS is a distributed operating system using Mesos as its kernel. Couchbase on Mesos using DC/OS and Amazon explained how to run a single Couchbase container on DC/OS using CloudFormation templates.

Running a single node Couchbase may work during initial development phase. The need to start a multi-node Couchbase cluster becomes eminent as you move along further in development, and certainly needed during the production phase.

So, you’d like to run a Couchbase cluster on DC/OS?

Couchbase Cluster on DC/OS is complete walk through of how to setup a Couchbase cluster on DC/OS. It walks through the following steps:

  • What is Couchbase?
  • Couchbase Cluster
  • Setup DC/OS on Amazon Web Services
  • Configure CLI and Install Marathon Load Balancer
  • Create Couchbase “startup” service
  • Create Couchbase “node” service
  • Scale Couchbase Cluster
  • Rebalance Couchbase Cluster
  • Conclusion

DC/OS dashboard with a Couchbase cluster looks like:

For further information check out:

  • Couchbase on Containers
  • Couchbase Developer Portal
  • Ask questions on Couchbase Forums or Stack Overflow
  • Download Couchbase

You can also follow us at @couchbasedev and @couchbase.

Source: http://blog.couchbase.com/2016/november/couchbase-cluster-mesos-dcos

Health Check of Docker Containers

One of the new features in Docker 1.12 is how health check for a container can be baked into the image definition. And this can be overridden at the command line.

Just like the CMD instruction, there can be multiple HEALTHCHECK instructions in Dockerfile but only the last one is effective.

This is a great addition because a container reporting status as Up 1 hour may return errors. The container may be up but there is no way for the application inside the container to provide a status. This instruction fixes that.

The Dockerfile that builds arungupta/couchbase image is:

It uses configure-node.sh script to configure the server using Couchbase REST API. The new instruction to notice here is HEALTHCHECK.

This instruction can be specified as:

The <options> can be:

  • --interval=DURATION (default 30s)
  • --timeout=DURATION (default 30s)
  • --retries=N (default 3)

The <command> is the command that runs inside the container to check the health.

If health check is enabled, then the container can have three states:

  • starting – Initial status when the container is still starting
  • healthy – If the command succeeds then the container is healthy
  • unhealthy – If a single run of the <command> takes longer than the specified timeout then it is considered unhealthy. If a health check fails then the <command> will run retries number of times and will be declared unhealthy if the <command> still fails.

The commands exit status indicates the health status of the container. The following values are allowed:

  • 0 – container is healthy
  • 1 – container is not healthy

In our instruction, /pools REST API is invoked using curl. If the command fails then an exit status of 1 is returned, and this marks the container unhealthy for that attempt. This command is invoked every 5 seconds. The container is marked unhealthy if the command does not return successfully within 3 seconds.

Run the container as:

Check the status:

Notice how health: starting status is reported in the STATUS column. Checking after a few seconds shows the status:

And now its reported healthy.

More details about this HEALTHCHECK instruction can be found on docs.docker.com.

Now, if you are running an image that does not have HEALTHCHECK instruction then the docker run command can be used to specify similar values. An equivalent runtime command would be:

Last 5 health checks for a container can be obtained using the docker inspect command:

The output is shown as:


Source: http://blog.couchbase.com/2016/november/docker-health-check-keeping-containers-healthy