Category Archives: techtip

Creating Smaller Java Image using Docker Multi-stage Build

Two of the announcements at DockerCon 2017 directly relevant to Java developers are:

  • Docker Multi-stage build
  • Oracle JRE in Docker Store

This blog explains the purpose of Docker multi-stage build and provide examples of how they help us generate smaller and more efficient Java Docker images.

Docker Multi-stage Build

Just show me the code: github.com/arun-gupta/docker-java-multistage.

What is the issue?

Building a Docker image for a Java application typically involves building the application and package the generated artifact into an image. A Java developer would likely use Maven or Gradle to build a JAR or WAR file. If you are using the Maven base image to build the application then it will download the required dependencies from the configured repositories and keep them in the image. The number of JARs in the local repository could be significant depending upon the number of dependencies in the pom.xml. This could leave a lot of cruft in the image.

Let’s take a look at a sample Dockerfile:

In this Dockerfile:

  • maven:3.5-jdk-8 is used as the base image
  • Application source code is copied to the image
  • Maven is used to build the application artifact
  • WildFly is downloaded and installed
  • Generated artifact is copied to the deployments directory of WildFly
  • Finally, WildFly is started

There are several issues with this kind of flow:

  • Using maven as the base image restricts on what functionality is available in the image. This requires WildFly to be downloaded and configured explicitly.
  • Building the artifact downloads all Maven dependencies. These stay in the image and are not needed at runtime. This causes an unnecessary bloat in the image size at runtime.
  • Change in WildFly version will require to update the Dockerfile. This would’ve been much easier if we could use the jboss/wildfly base image by itself.
  • In addition, unit tests may run before packaging the artifact and integration tests after the image is created. The test dependencies and results is again not needed to live in the production image.

There are other ways to build the Docker image. For example, splitting the Dockerfile into two files. The first file will then build the artifact and copy the artifact to a common location using volume mapping. The second file will then pick up the generated artifact and then use the lean base image. This approach has also has issues where multiple Dockerfiles need to be maintained separately. Additional, there is an out-of-band hand-off between the two Dockerfiles.

Let’s see how these issues are resolved with multi-stage build.

What are Docker multi-stage build?

Multi-stage build allows multiple FROM statements in a Dockerfile. The instructions following each FROM statement and until the next one, creates an intermediate image. The final FROM statement is the final base image. Artifacts from intermediate stages can be copied using COPY --from=<image-number>, starting from 0 for the first base image. The artifacts not copied over are discarded. This allows to keep the final image lean and only include the relevant artifacts.

FROM syntax is updated to specify stage name using as <stage-name>. For example:

This allows to use the stage name instead of the number with --from option.

Let’s take a look at a sample Dockerfile:

In this Dockerfile:

  • There are two FROM instructions. This means this is a two-stage build.
  • maven:3.5-jdk-8 is the base image for the first build. This is used to build the WAR file for the application. The first stage is named as BUILD.
  • jboss/wildfly:10.1.0.Final is the second and the final base image for the build. WAR file generated in the first stage is copied over to this stage using COPY --from syntax. The file is directly copied in the WildFly deployments directory.

Let’s take a look at what are some of the advantages of this approach.

Advantages of Docker multi-stage build

  • One Dockerfile has the entire build process defined. There is no need to have separate Dockerfiles and then coordinate transfer of artifact between “build” Dockerfile and “run” Dockerfile using volume mapping.
  • Base image for the final image can be chosen appropriately to meet the runtime needs. This helps with reduction of the overall size of the runtime image. Additionally, the cruft from build time is discarded during intermediate stage.
  • Standard WildFly base image is used instead of downloading and configuring the distribution manually. This makes it a lot easier to update the image if a newer tag is released.

Size of the image built using a single Dockerfile is 816MB. In contrast, the size of the image built using multi-stage build is 584MB.

Docker Multi-stage Java Image

So, using a multi-stage helps create a much smaller image.

Is this a typical way of building Docker image? Are there other ways by which the image size can be reduced?

Sure, you can use docker-maven-plugin as shown at github.com/arun-gupta/docker-java-sample to build/test the image locally and then push to repo. But this mechanism allows you to generate and package artifact without any other dependency, including Java.

Sure, maven:jdk-8-alpine image can be used to create a smaller image. But then you’ll have to create or find a WildFly image built using jdk-8-alpine, or something similar, as well. But the cruft, such as maven repository, two Dockerfiles, sharing of artifact using volume mapping or some other similar technique would still be there.

There are other ways to craft your build cycle. But if you are using Dockerfile to build your artifact then you should seriously consider multi-stage builds.

Read more discussion in PR #31257.

As mentioned earlier, the complete code for this is available at github.com/arun-gupta/docker-java-multistage.

Sign up for Docker Online Meetup to get a DockerCon 2017 recap.

Docker Remote API on Windows and OSX

There are multiple ways to monitor Docker containers.

  • Docker CLI provides the docker container stats API that gives basic information about the running containers.
  • Docker Remote API provides more detailed information about the containers.
  • Starting with Docker 1.13, there is an experimental feature with a Prometheus endpoint
  • cAdvisor is an open source tool that provides last container usage and performance characteristics. This data can be stored in a time series database, such as InfluxDB. This data can then be shown in a fancy graph using a Kibana dashboard.

These options were covered in detail in an earlier blog.

There are other commercial options like Docker EE, Sysdig, Datadog, New Relic, App Dynamics and others. If you are running containers on AWS, then CloudWatch can provide integrated monitoring.

OSX is my primary development platform. But recently, I needed a way to monitor Docker containers using the Remote API (aka REST API) on a Windows machine. The output of the REST API is exactly same independent of the operating system. But the way to access the Docker REST API using curl is different on an OSX and a Windows machine. This blog will explain how to exactly access this API on these two operating systems.

Check out 1.27 swagger specification to learn more about the capabilities of the REST API. A nicer and a more readable version of the API can be seen using Swagger UI. This is broken until #32649 is fixed.

Complete details about how the REST API corresponds to different Docker versions is explained in Docker REST API Versioning.

We’ll dig into this a bit later but first let’s take a look on how this API can be accessed.

Docker Remote API on OSX

On OSX, curl connects using a Unix domain socket as shown:

A WildFly container can be started as:

Stats can then be obtained using the command:

This will start printing stats as:

These stats are refreshed every second.

Any other REST API can be invoked very easily with this. This is simple and straight forward.

Install Docker on Windows

Docker installation on Windows depends on the flavor of your operating system.

Are you using Windows 10+ Pro 64-bit, then use Docker for Windows.

If using any older version of Windows, then you need to use Docker Toolbox.

Are you installing Windows in a virtual machine? Then Virtual Box cannot be used to create the VM. This is because Virtual Box does not support nested virtualization. This is required as Docker Toolbox uses Virtual Box to create and start Docker Machine. VMWare Fusion seems to work fine here though.

Now that you know that VMWare Fusion needs to be used, make sure you enable nested virtualization before starting the virtual machine.

Many thanks to Stefan Scherer (@stefscherer) for helping me understand the Windows configuration details.

Let’s see how the Docker REST API can now be invoked.

Docker Remote API on Windows 7/8

This section shows how to invoke the REST API using curl on Windows 7/8.

The REST API can be invoked using curl as shown:

First of all, the REST API, /containers/<name-or-id>/stats, is exactly the same. The way this API can be invoked is a bit different.

There are four differences: The first three parameters specify security credentials for the Docker Machine generated by Docker Toolbox on your Windows box:

  • <CERT> is the SSL certificate for Docker Machine
  • <CA_CERT> is the Certificate Authority certificate for the Docker Machine
  • <KEY> is the key generated for the Docker Machine

The values of these configuration parameters is those generated by docker-machine CLI.

The last change is that the protocol is changed from http to https.

Here is the exact command that worked on Windows 7 VM:

This invocation will print the exact same stats output on Windows 7 VM.

Now that you know how to use this API on OSX and Windows, you can also this API to do everything that Docker CLI. This is because the Docker CLI is just a convenient wrapper over the REST API. So a docker container run command is invoking the appropriate REST API on the Docker Host.

Docker Remote API on Windows 10

If you are using Windows 10, then use Docker for Windows. After that, you need to figure out which curl command to be used. There are couple of options:

  • Use Bash shell on Windows. It has curl command that works like Unix command that we all know pretty well. In this case, the REST API can be invoked as:
    Docker for Windows listens on port 2375 on Windows.
  • If you are Powershell user, then install curl command as:
    Now the command to invoke the REST API is:
    Note, there is a curl alias in Powershell and that is an alias for Invoke-WebRequest. So make sure to use curl.exe to invoke the REST API as this is the command installed using Chocolatey.

This blog provided different options of how to invoke the Docker Remote API using curl on Windows and OSX.


Deploy Docker Compose Services to Swarm

Docker 1.13 introduced a new version of Docker Compose. The main feature of this release is that it allow services defined using Docker Compose files to be directly deployed to Docker Engine enabled with Swarm mode. This enables simplified deployment of multi-container application on multi-host.

Docker 1.13

This blog will show use a simple Docker Compose file to show how services are created and deployed in Docker 1.13.

Here is a Docker Compose v2 definition for starting a Couchbase database node:

This definition can be started on a Docker Engine without Swarm mode as:

This will start a single replica of the service define in the Compose file. This service can be scaled as:

If the ports are not exposed then this would work fine on a single host. If swarm mode is enabled on on Docker Engine, then it shows the message:

Docker Compose gives us multi-container applications but the applications are still restricted to a single host. And that is a single point of failure.

Swarm mode allows to create a cluster of Docker Engines. With 1.13, docker stack deploy command can be used to deploy a Compose file to Swarm mode.

Here is a Docker Compose v3 definition:

As you can see, the only change is the value of version attribute. There are other changes in Docker Compose v3. Also, read about different Docker Compose versions and how to upgrade from v2 to v3.

Enable swarm mode:

Other nodes can join this swarm cluster and this would easily allow to deploy the multi-container application to a multi-host as well.

Deploy the services defined in Compose file as:

A default value of Compose file here would make the command a bit shorter. #30352 should take care of that.

List of services running can be verified using docker service ls command:

The list of containers running within the service can be seen using docker service ps command:

In this case, a single container is running as part of the service. The node is listed as moby which is the default name of Docker Engine running using Docker for Mac.

The service can now be scaled as:

The list of container can then be seen again as:

Note that the containers are given the name using the format <service-name>_n. Both the containers are running on the same host.

Also note, the two containers are independent Couchbase nodes and are not configured in a cluster yet. This has already been explained at Couchbase Cluster using Docker and a refresh of the steps is coming soon.

A service will typically have multiple containers running spread across multiple hosts. Docker 1.13 introduces a new command docker service logs <service-name> to stream the log of service across all the containers on all hosts to your console. In our case, this can be seen using the command docker service logs couchbase_db and looks like:

The preamble of the log statement uses the format <container-name>.<container-id>@<host>. And then actual log message from your container shows up.

At first instance, attaching container id may seem redundant. But Docker services are self-healing. This means that if a container dies then the Docker Engine will start another container to ensure the specified number of replicas at a given time. This new container will have a new id. And thus it allows  to attach the log message from the right container.

So a quick comparison of commands:

 Docker Compose v2  Docker compose v3
 Start services docker-compose up -d docker stack deploy --compose-file=docker-compose.yml <stack-name> 
 Scale service docker-compose scale <service>=<replicas> docker service scale <service>=<replicas>
 Shutdown docker-compose down docker stack rm <stack-name>
 Multi-host No Yes

Want to get started with Couchbase? Look at Couchbase Starter Kits.

Want to learn more about running Couchbase in containers?

  • Couchbase on Containers
  • Couchbase Forums
  • Couchbase Developer Portal
  • @couchhasedev and @couchbase

Source: https://blog.couchbase.com/2017/deploy-docker-compose-services-swarm

Microservice using AWS Serverless Application Model and Couchbase

Amazon Web Services introduced Serverless Application Model, or SAM, a couple of months ago. It defines simplified syntax for expressing serverless resources. SAM extends AWS CloudFormation to add support for API Gateway, AWS Lambda and Amazon DynamoDB. This blog will show how to create a simple microservice using SAM. Of course, we’ll use Couchbase instead of DynamoDB!

This blog will also use the basic concepts explained in Microservice using AWS API Gateway, AWS Lambda and Couchbase. SAM will show the ease with which the entire stack for microservice can be deployed and managed.

As a refresher, here are key components in the architecture:

serverless-microservice

  • Client could be curl, AWS CLI/Console, Postman client or any other tool/API that can invoke a REST endpoint.
  • AWS API Gateway is used to provision APIs. The top level resource is available at path /books. HTTP GET and POST methods are published for the resource.
  • Each API triggers a Lambda function. Two Lambda functions are created, book-list function for listing all the books available and book-create function to create a new book.
  • Couchbase is used as a persistence store in EC2. All the JSON documents are stored and retrieved from this database.

Other blogs on serverless:

  • Microservice using AWS API Gateway, AWS Lambda and Couchbase
  • AWS IoT Button, Lambda and Couchbase
  • Serverless FaaS with Lambda and Java

Let’s get started!

Serverless Application Model (SAM) Template

An AWS CloudFormation template with serverless resources conforming to the AWS SAM model is referred to as a SAM file or template. It is deployed as a CloudFormation stack.

Let’s take a look at our SAM template:

This template is available at github.com/arun-gupta/serverless/blob/master/aws/microservice/template.yml.

SAM template Specification provide complete details about contents in the template. The key parts of the template are:

  • Defines two resources, both of Lambda Function type identified by AWS::Serverless::Function attribute. Name of the Lambda function is defined by Resources.<resource>.
  • Class for each handler is defined by the value of Resources.<resource>.Properties.Handler attribute
  • Java 8 runtime is used to run the Function defined by Resources.<resource>.Properties.Runtime attribute
  • Code for the class is uploaded to an S3 bucket, in our case to s3://serverless-microservice/microservice-http-endpoint-1.0-SNAPSHOT.jar
  • Resources.<resource>.Properties.Environment.Variables.COUCHBASE_HOST attribute value defines the host where Couchbase is running. This can be easily deployed on EC2 as explained at Setup Couchbase.
  • Each Lambda function is triggered by an API. It is deployed using AWS API Gateway. The path is defined by Events.GetResource.Properties.Path. HTTP method is defined using Events.GetResource.Properties.Method attribute.

Java Application

The Java application that contains the Lambda functions is at github.com/arun-gupta/serverless/tree/master/aws/microservice/microservice-http-endpoint.

Lambda function that is triggered by HTTP GET method is shown:

A little bit of explanation:

  • Each Lambda function needs to implement the interface com.amazonaws.services.lambda.runtime.RequestHandler.
  • API Gateway and Lambda integration require a specific input format and output format. These formats are defined as GatewayRequest and GatewayResponse classes.
  • Function logic uses Couchbase Java SDK to query the Couchbase database. N1QL query is used to query the database. The results and exception are then wrapped in GatewayRequest and GatewayResponse.

Lambda function triggered by HTTP POST method is pretty straightforward as well:

A bit of explanation:

  • Incoming request payload is retrieved from GatewayRequest
  • Document inserted in Couchbase is returned as response.
  • Like the previous method, Function logic uses Couchbase Java SDK to query the Couchbase database. The results and exception are then wrapped in GatewayRequest and GatewayResponse.

Build the Java application as:

Upload Lambda Function to S3

SAM template reads the code from an S3 bucket. Let’s create a S3 bucket:

us-west-2 region is one of the supported regions for API Gateway. S3 bucket names are globally unique but their location is region specific.

Upload the code to S3 bucket:

The code is now uploaded to S3 bucket. SAM template is ready to be deployed!

Deploy SAM Template

Deploy the SAM template:

It shows the output:

This one command deploys Lambda functions and REST Resource/APIs that trigger these Lambda functions.

Invoke the Microservice

API Gateway publishes a REST API that can be invoked by curl, wget, AWS CLI/Console, Postman or any other app that can call a REST API. This blog will use AWS Console to show the interaction.

API Gateway home at us-west-2.console.aws.amazon.com/apigateway/home?region=us-west-2#/apis shows:

AWS SAM Microservice API

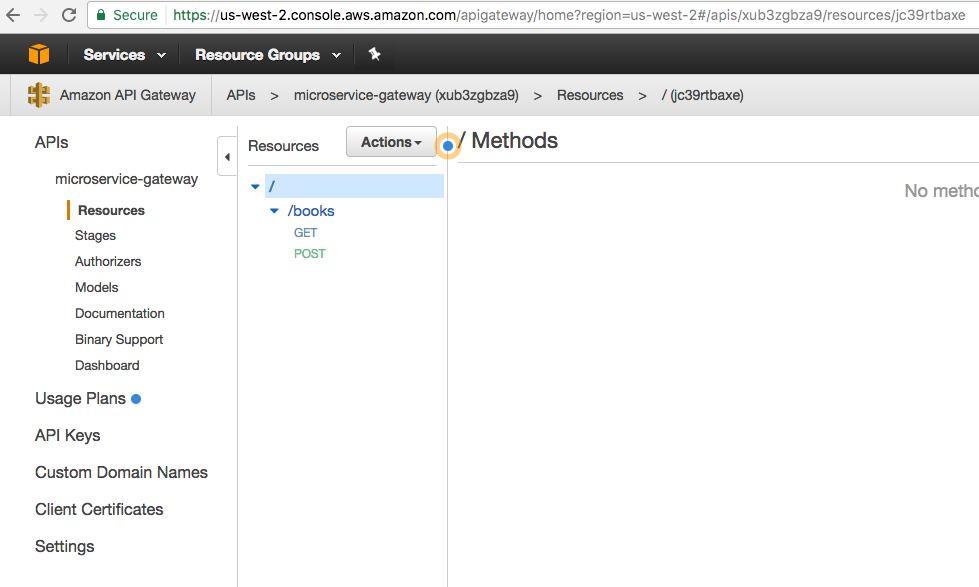
Click on the API to see all the APIs in this resource:

AWS SAM Microservice API Resources

Click on POST to see the default page for POST method execution:

AWS SAM Microservice API POST

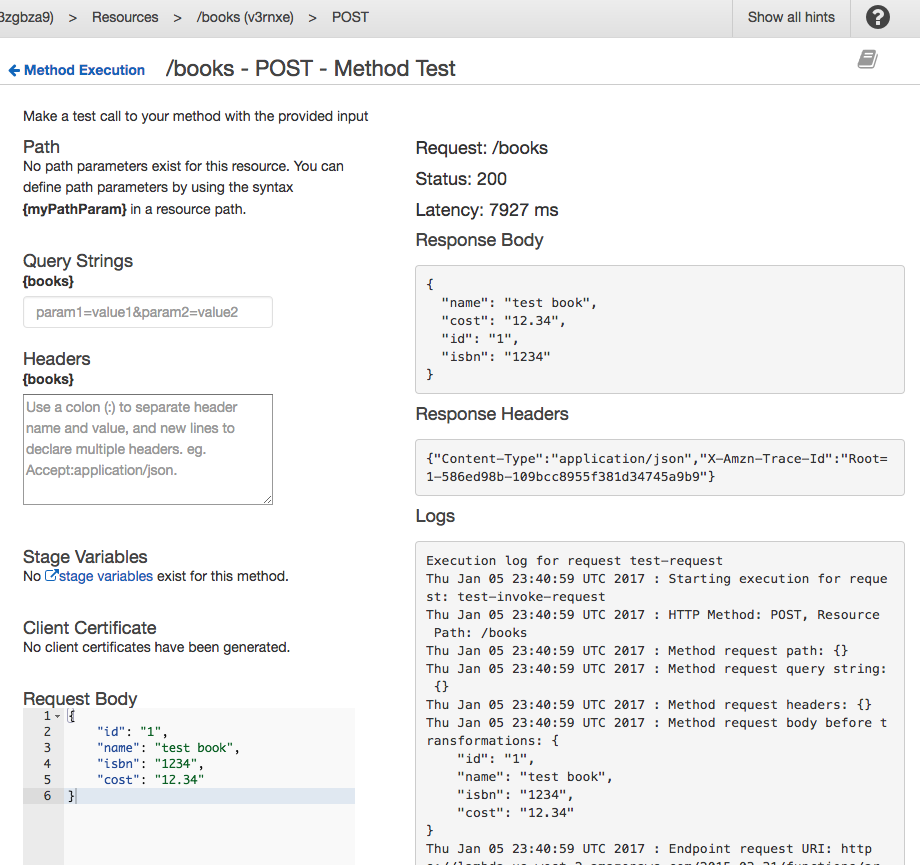
Click on Test to test the API:

AWS SAM Microservice API POST Input

Add the payload in Request Body and click on Test to invoke the API. The results are shown as below:

AWS SAM Microservice API POST Output

Now click on GET to see the default execution page:

AWS SAM Microservice API GET

Click on Test to test the API:

AWS SAM Microservice API GET Input

No request body is needed, just click on Test the invoke the API. The results are as shown:

AWS SAM Microservice API GET Output

Output from the Couchbase database is shown in the Response Body.

References

  • Deploying Lambda-based Applications
  • Serverless Architectures
  • AWS API Gateway
  • Creating a simple Microservice using Lambda and API Gateway
  • Couchbase Server Docs
  • Couchbase Forums
  • Follow us at @couchbasedev

Source: blog.couchbase.com/2017/january/microservice-aws-serverless-application-model-couchbase

AWS IoT Button, Lambda and Couchbase

Getting Started with Serverless FaaS and AWS Lambda shows how to use a simple Java function to store a JSON document to Couchbase using AWS Lambda. This blog builds upon that and shows how an AWS IoT Button can be used as a trigger for that Lambda function.

By end of this blog, you’ll learn:

  • How to configure AWS IoT Button
  • Use IoT Button as trigger for Lambda Function
  • Test IoT button

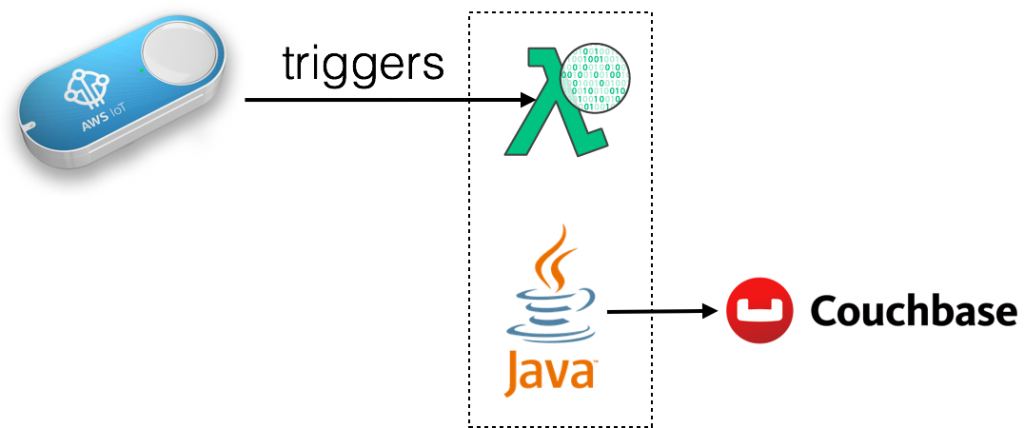
The overall flow will be:

serverless-iot-couchbase

Iot button click will invoke HelloCouchbaseLambda Lambda function. This function is uses Couchbase Java SDK to create a JSON document in Couchbase.

This blog is also playing catch up with Collecting iBeacon Data with Couchbase and Raspberry Pi IoT Devices by Nic and The CouchCase by Matthew on their summer projects. One last blog will be published in this series. That will show how multiple AWS IoT buttons can be used for some fun.

Let’s get started!

Configure IoT Button

The fastest way to configure IoT button  is using the mobile app for iOS or Android.


More details about configuring IoT Button using mobile app.

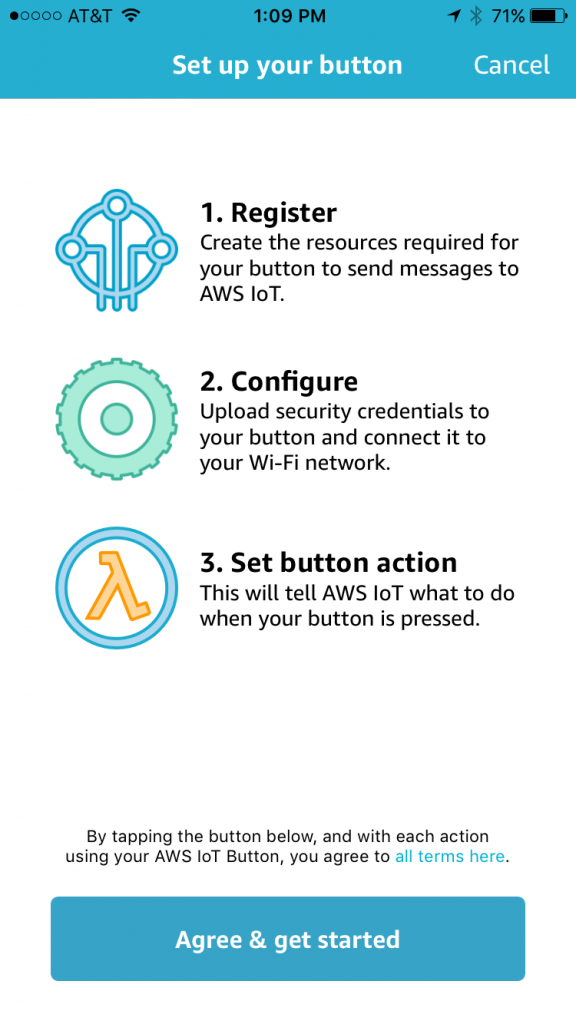
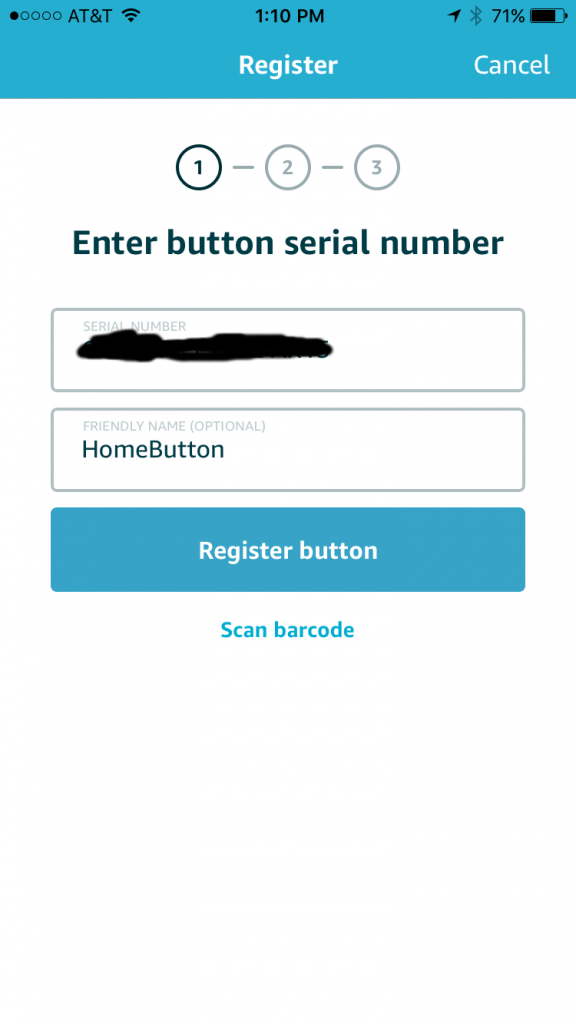
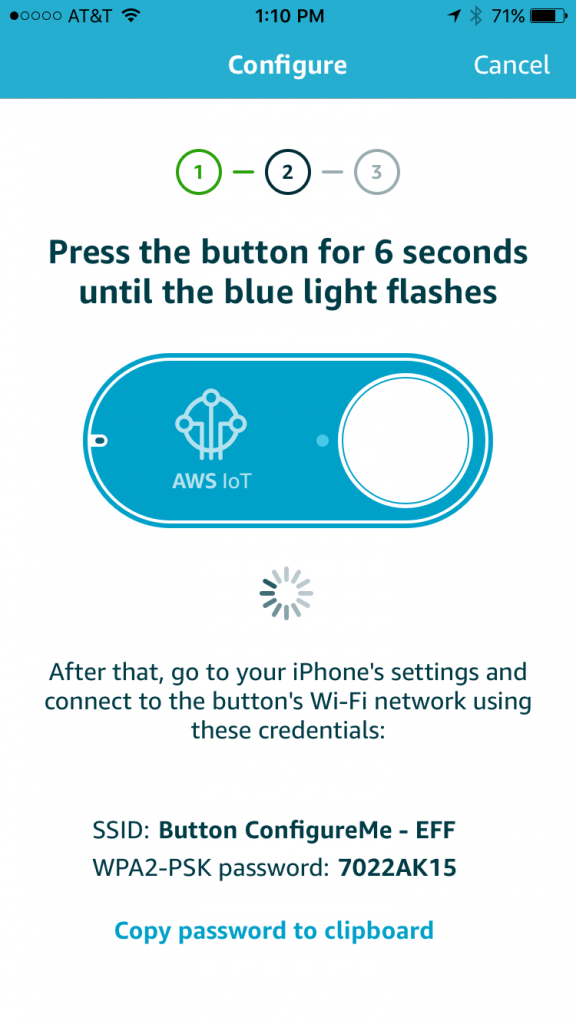
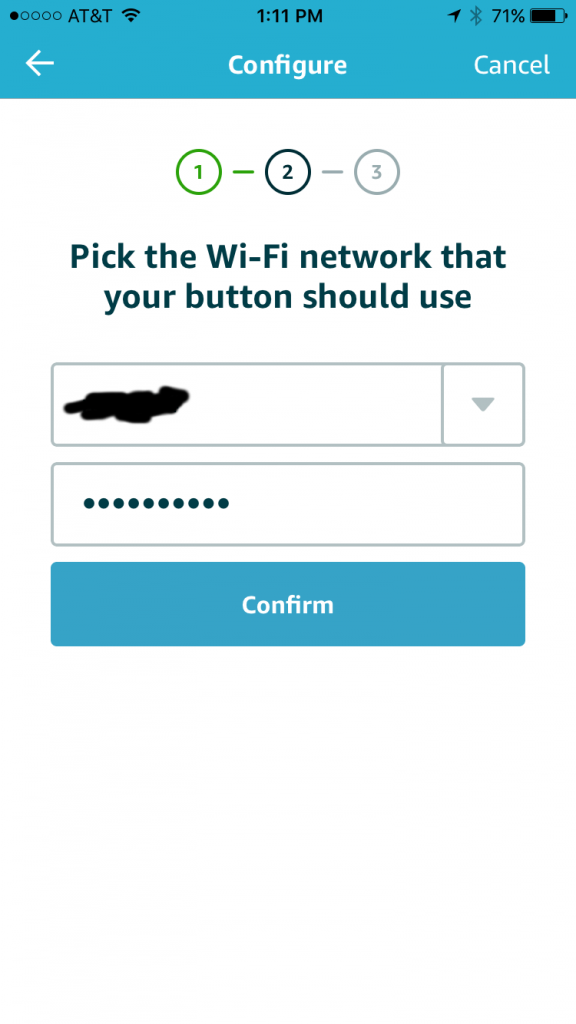
Here are some snapshots from configuring button using the mobile app.

Bring up the app, click on + to start configuring a new button:

aws-iot-button-configure-1

Enter button’s serial number:

aws-iot-button-configure-2

Register the button:

aws-iot-button-configure-3

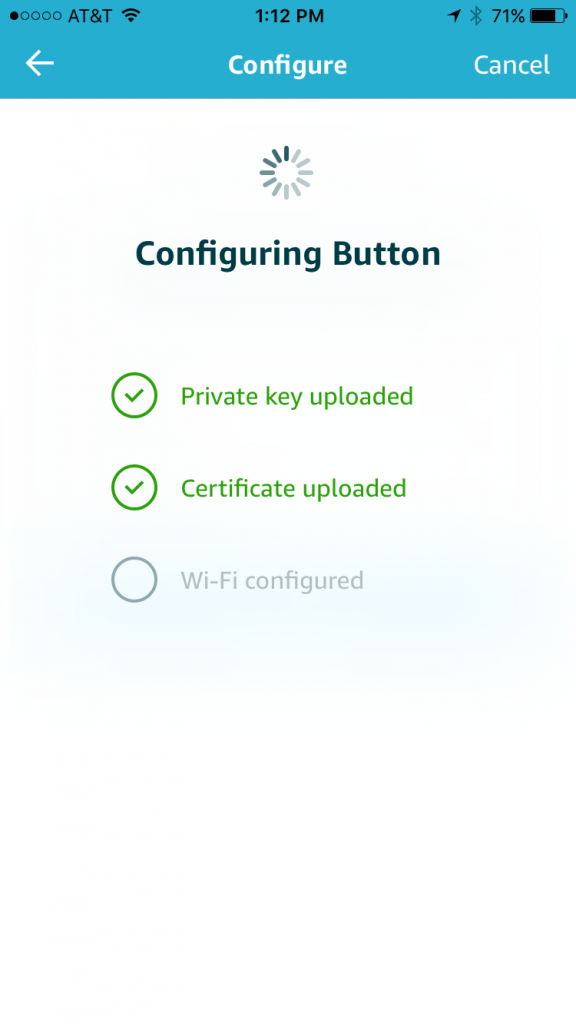
Configure the button with wifi network:

aws-iot-button-configure-4

Upload all the certificates etc:

aws-iot-button-configure-5

After this, the button is configured and ready to use. This blog skipped the part where a template Lambda Function is associated with the button click.

If  mobile app cannot be used then the button can be configured manually.

Use IoT Button as Trigger for Lambda Function

The aws lambda create-event-source-mapping CLI allows to create an event source for Lambda function. As of AWS CLI version 1.11.21, only Amazon Kinesis stream or an Amazon DynamoDB stream can be used. But for this blog, we’ll use IoT button as a trigger. And this has to be configured using AWS Lambda Console.

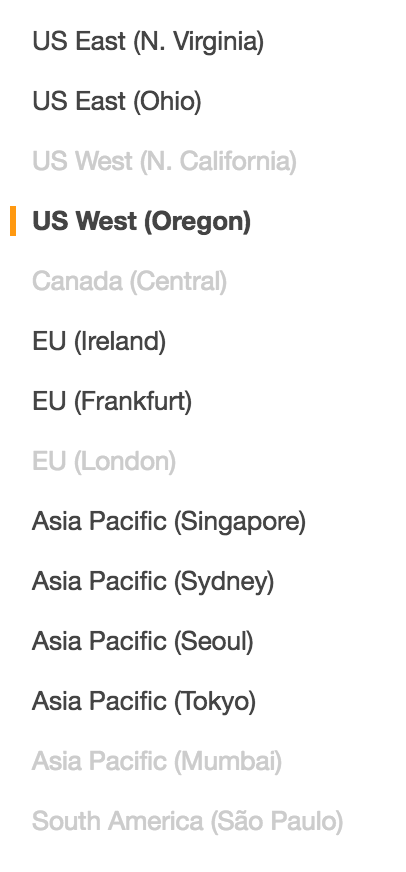
IoT Button is only supported in a limited number of regions. For example, it is not supported in the us-west-1 region but us-west-2 region works.

The list of regions not supported are greyed out in the following list:

aws-iot-buttons-supported-region

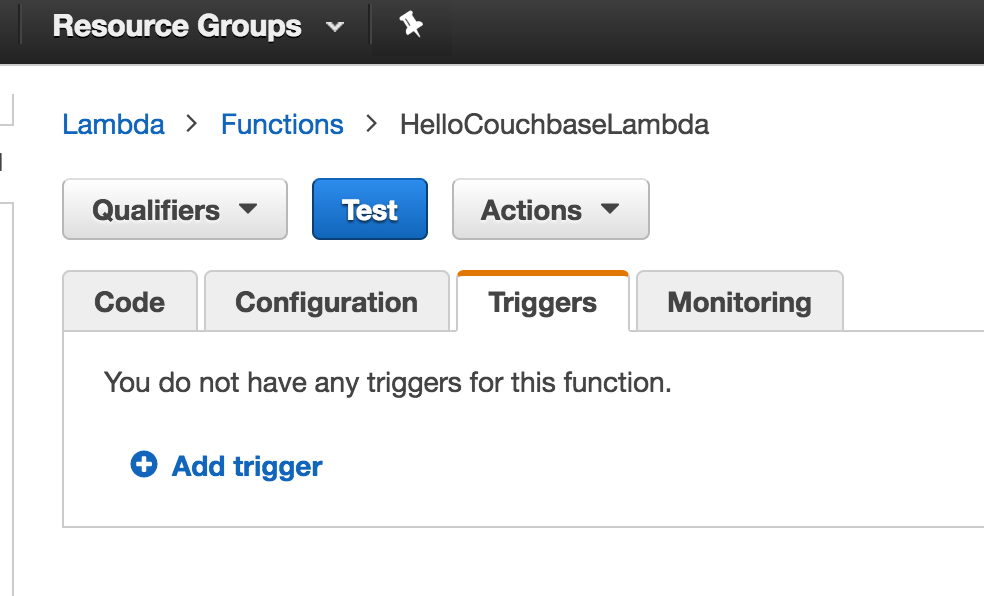
Lambda Function can be triggered by several events. Lambda Function is invoked when any of these events occur. By default, no triggers are associated with a Lambda Function. For our HelloCouchbaseLambda function, these can be seen at us-west-2.console.aws.amazon.com/lambda/home?region=us-west-2#/functions/HelloCouchbaseLambda?tab=triggers.

AWS Lambda Default Triggers

Click on Add trigger to add a new trigger:

AWS Lambda Add Trigger

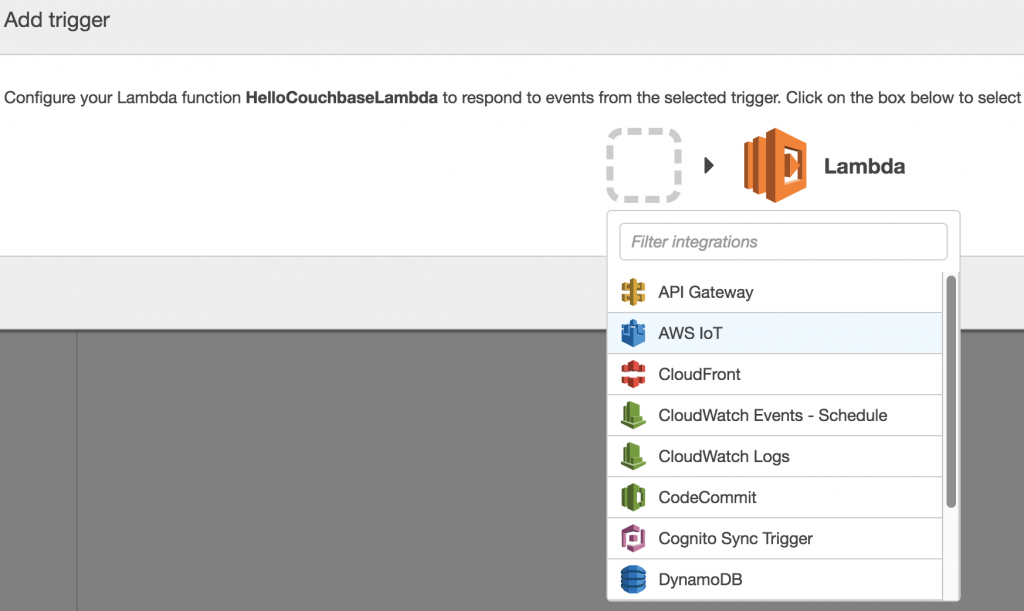
Select on the empty square to create a new trigger, and select AWS IoT:

AWS Lambda Add IoT Trigger

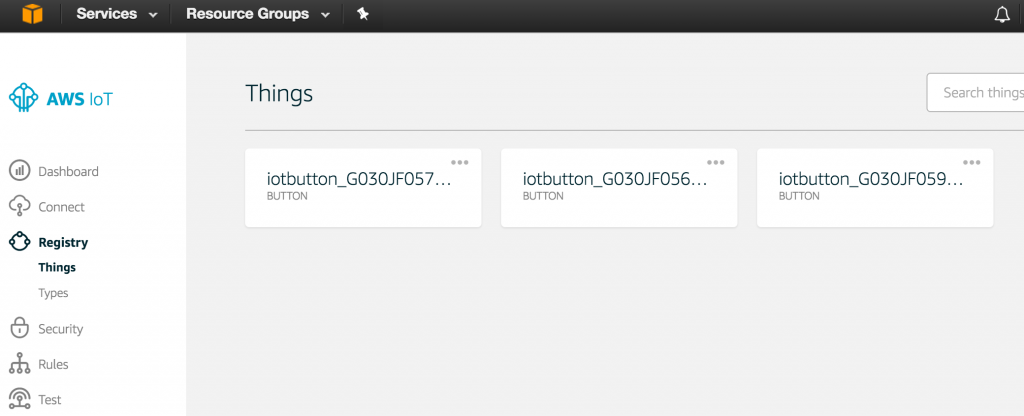
For the button previously registered, get the serial number from us-west-2.console.aws.amazon.com/iotv2/home?region=us-west-2#/thinghub:

aws-iot-things-hub

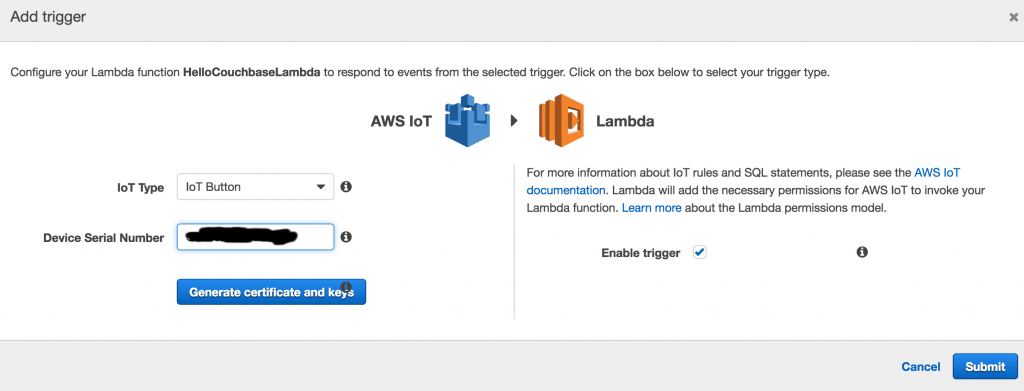
Specify the serial number of the button in the AWS IoT trigger:

aws-iot-add-trigger

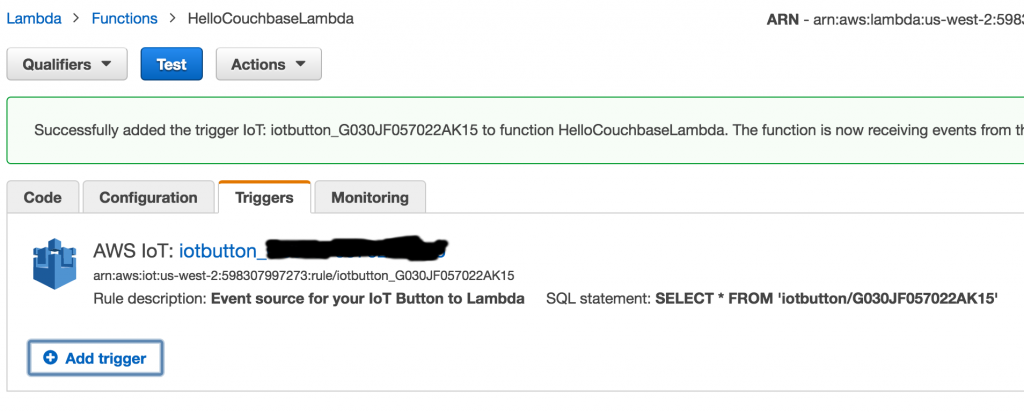
Click on Submit to create the trigger:

aws-iot-added-trigger

And this confirms that the trigger has been added.

Test IoT Button

Before testing the button, let’s login to the Couchbase instance and verify the number of JSON documents in the bucket:

aws-iot-button-couchbase-console-default

This can be verified at http://<EC2-IP-Address>:8091/index.html#sec=buckets. As expected, no documents exists in the bucket.

Press the button once, and refresh the page. It shows that one document is now stored in the bucket. This is verified in the Couchbase Web Console:

aws-iot-button-couchbase-console-one-document

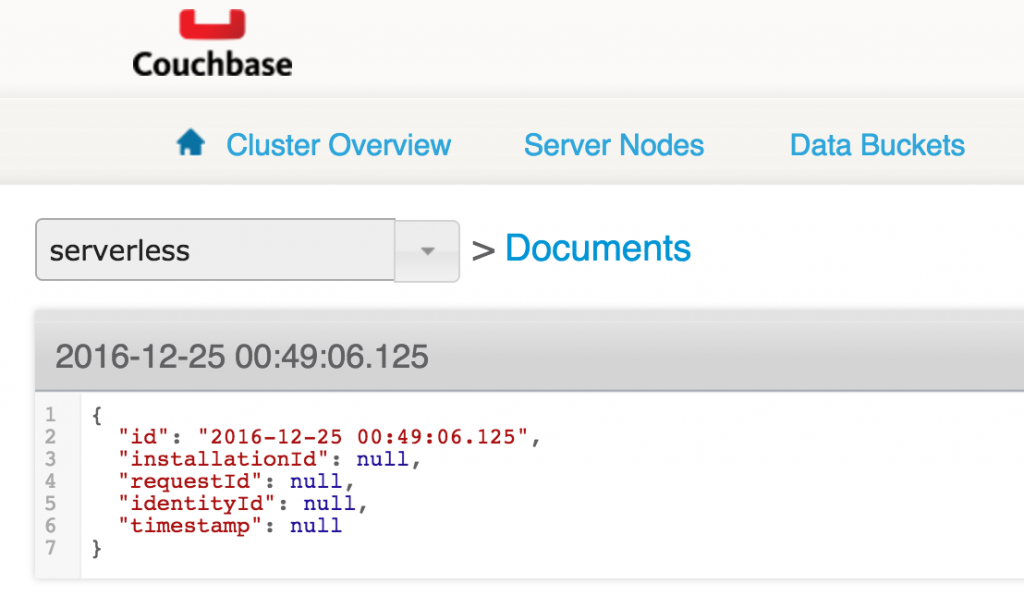
Click on Documents to see the complete list of documents:

aws-iot-button-couchbase-one-document-2

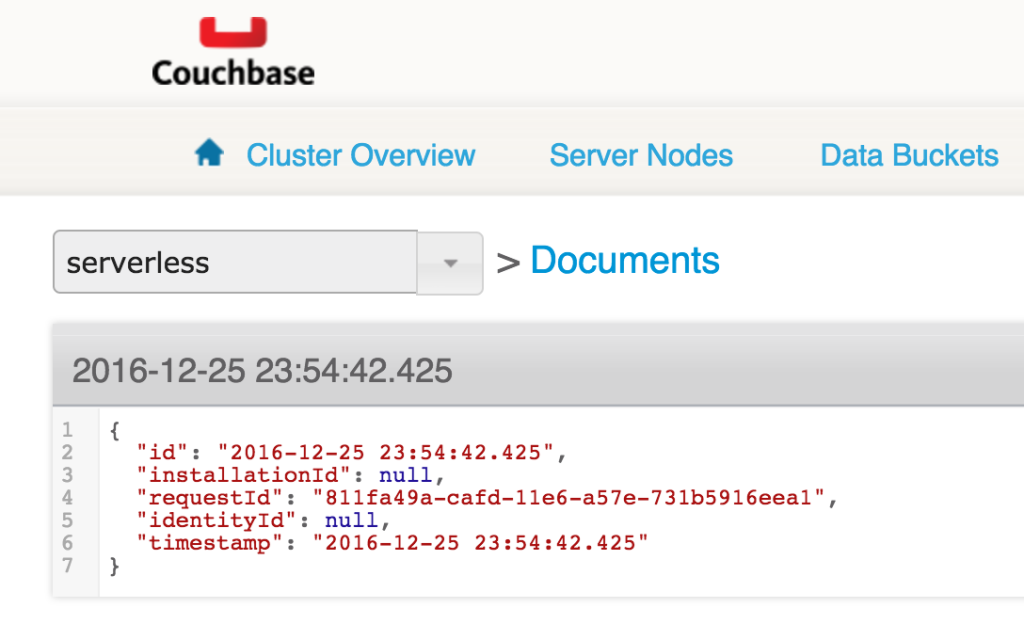
Click on the document ID to see more details about the document:

aws-iot-button-couchbase-one-document-details

Only timestamp is stored in this JSON document.

Now, let’s update HelloCouchbaseLambda code to include request id in the document as well. This can be achieved by adding the following line of code in the Java class:

A new deployment package can be built and uploaded using the following command:

Now clicking the button will update the number of documents. But the updated document will have an additional attribute populated as shown:

aws-iot-button-couchbase-second-document-details

How are you going to take AWS IoT button and use it with Lambda and Couchbase? Let us know at Couchbase Forums.

References

  • AWS IoT Button
  • AWS IoT Button Developer Guide
  • Couchbase Server Docs
  • Couchbase Forums
  • Follow us at @couchbasedev

Source: https://blog.couchbase.com/2016/december/aws-iot-button-lambda-couchbase

Serverless FaaS with AWS Lambda and Java

What is Serverless Architecture?

Serverless architecture runs custom code in ephemeral containers that are fully managed by a 3rd party. The custom code is typically a small part of a complete application. It is also called as function. This gives another name for serverless architecture as Function as a Service (FaaS). The container is ephemeral because it may only last for one invocation. The container may be reused but that’s not something you can rely upon. As a developer, you upload the code to FaaS platform, the service then handles all the capacity, scaling, patching and administration of the infrastructure to run your code.

An application built using Serverless Architecture follows the event-driven approach. For example, an activity happened in the application such as a click. This is

This is very different from a classical architecture where the application code is typically deployed in an application server such as Tomcat or WildFly. Scaling your application means starting additional instances of the application server or spinning up additional containers with the packaged application server. The Load Balancer need to be updated with the new IP addresses. Operating system need to be patched, upgraded and maintained.

Serverless Architectures explain the difference between the classical programming model and this new serverless architecture.

FaaS platform takes your application is divided into multiple functions. Each function is deployed in FaaS. The service spins up additional compute instances to meet the scalability demands of your application. FaaS platform provides the execution environment and takes care of starting and tearing down the containers to run your function.

Read Serverless Architectures for more details about these images.

One of the big advantages of FaaS is that you are only charged for the compute time, i.e. the time your code is running. There is no charge when your code is not running.

Another way to look at how Functions are different from VMs and Containers:

vm-containers-serverless

Note that Linux containers instead of Docker containers are used as an implementation for AWS Lambda.

How is FaaS different from PaaS?

As quoted at Serverless Architectures, a quick answer is provided by the following tweet:

In other words most PaaS applications are not geared towards bringing entire applications up and down for every request, whereas FaaS platforms do exactly this.

Abstracting the Back-end with FaaS explain the difference with different *aaS offerings. The image from the blog is captured below:

faas

Serverless Architectures also provide great details about what FaaS is and is not.

AWS Lambda, Google Cloud Functions and Azure Functions are some of the options for running serverless applications.

This blog will show how to write your first AWS Lambda function.

What is AWS Lambda?

AWS Lambda is FaaS service from Amazon Web Services. It runs your code on a high-availability compute infrastructure and performs all of the administration of the compute resources, including server and operating system maintenance, capacity provisioning and automatic scaling, code monitoring and logging.

AWS Lambda charges you for the duration your code runs in increments of 100ms. There is no cost associated with storing the Lambda function in AWS. First million requests per month are free and the pricing after that is nominal. Read more details on Lambda pricing. It also provides visibility into performance by providing real time metrics and logs to AWS CloudWatch. All you need to do is write the code!

Here is a quick introduction:

Also check out What’s New in AWS Lambda from AWS ReInvent 2016:

Also checkout Serverless Architectural Patterns and Best Practices from AWS ReInvent 2016:

The code you run on AWS Lambda is called a Lambda Function. You upload your code as a zip file or design it using the AWS Lambda Management Console. There is a built-in support for AWS SDK and this simplifies the ability to call other AWS services.

In short, Lambda is scalable, serverless, compute in the cloud.

AWS Lambda provides several execution environments:

  • Node.js – v0.10.36, v4.3.2 (recommended)
  • Java – Java 8
  • Python – Python 2.7
  • .NET Core – .NET Core 1.0.1 (C#)

This blog will show:

  • Build a Java application that stores a JSON document to Couchbase
  • Use Maven to create a deployment package for Java application
  • Create a Lambda Function
  • Update the Lambda Function

The complete code in this blog is available at github.com/arun-gupta/serverless/tree/master/aws/hellocouchbase.

Java Application for AWS Lambda

First, lets look at a Java application that will be used for this Lambda function. Programming Model for Lambda Functions in Java provide more details about how to write your Lambda function code in Java.

Our Lambda function will implemented the pre-defined interface com.amazonaws.services.lambda.runtime.RequestHandler. The code looks like:

handleRequest method is where the function code is implemented. Context provides useful information about Lambda execution environment. Some of the information from the context is stored a JSON document. Finally, Couchbase Java SDK API upsert is used to write a JSON document to the identified Couchbase instance. Couchbase on Amazon EC2 provide complete instructions to install Couchbase on AWS EC2.

Information about the Couchbase server is obtained as:

This is once again using Couchbase Java API CouchbaseCluster as a main entry point to the Couchbase cluster. The COUCHBASE_HOST environment variable is passed when the Lambda function is created. In our case, this would point to a single node Couchbase cluster running on AWS EC2. Environment variables were recently introduced in AWS Lambda.

Finally, you need to access bucket in the server:

The bucket name is serverless and all JSON documents are stored in this.

A simple Hello World application may be used for creating this function as well.

Create AWS Lambda Deployment Package

AWS Lambda function needs a deployment package. This package is either a .zip or .jar file that contains all the dependencies of the function. Our application is packaged using Maven, and so we’ll use a Maven plugin to create a deployment package.

The application has pom.xml with the following plugin fragment:

More details about Maven configuration are available in Creating a .jar Deployment Package Using Maven without any IDE. The maven-shade-plugin allows to create an uber-jar including all the dependencies. The shade goal is tied to the package phase. So the mvn package command will generate a single deployment jar.

Package the application using mvn package command. This will show the output:

The target/hello-couchbase-1.0-SNAPSHOT.jar is the shaded jar that will be deployed to AWS Lambda.

More details about creating a deployment package are at Creating a Deployment Package.

Create AWS Lambda Function

Create AWS Lambda Function using AWS CLI. The CLI command in this case looks like:

In this CLI:

  • create-function creates a Lambda function
  • --function-name provides the function name. The function name is case sensitive.
  • --role specifies Amazon Resource Name (ARN) of an IAM role that Lambda assume when it executes your function to access any other AWS resources. If you’ve executed a Lambda function using AWS Console then this role is created for you.
  • --zip-file points to the deployment package that was created in previous step. fileb is an AWS CLI specific protocol to indicate that the content uploaded is binary.
  • --handler is the Java class that is called to begin execution of the function
  • --publish request AWS Lambda to create the Lambda function and publish a version as an atomic operation. Otherwise multiple versions may be created and may be published at a later point.

Lambda Console shows:

servleress-couchbase-lambda-function

Test AWS Lambda Function

Test the AWS Lambda Function using AWS CLI.

It shows the output as:

The output from the command is stored in hellocouchbase.out and looks like:

Invoking this function stores a JSON document in Couchbase. Documents stored in Couchbase can be seen using Couchbase Web Console. The password is Administrator and password is the EC2 instance id.

All data buckets in this Couchbase instance are shown below:

serverless-couchbase-bucket-overview

Note that the serverless bucket is manually created.

Clicking on Documents shows details of different documents stored in the bucket:

serverless-couchbase-bucket-documents

Clicking on each document shows more details about the JSON document:

serverless-couchbase-bucket-document

Lambda function can also be tested using the Console:

serverless-couchbase-console-test

Update AWS Lambda Function

If the application logic changes then a new deployment package needs to be uploaded for the Lambda function. In this case, mvn package will create a deployment package and aws lambda CLI command is used to update the function code:

Shows the result:

The function can then be invoked again.

During writing of this blog, this was often used to debug the function as well. This is because Lambda functions do not have any state or box associated with them. And so you cannot log in to a box to check out if the function did not deploy correctly. You can certainly use CloudWatch log statements once the function is working.

AWS Lambda References

  • Serverless Architectures
  • AWS Lambda: How it works
  • Couchbase Server Docs
  • Couchbase Forums
  • Follow us at @couchbasedev

Source: https://blog.couchbase.com/2016/december/serverless-faas-aws-lambda-java

Couchbase Weekly, Apr 18, 2016

Learn what’s latest in the Couchbase Community.
Couchbase Developer Community

Let us know if we missed anything at @couchbasedev, @couchbase or #Couchbase.

Couchbase Weekly

Highlights

Events

  • April 20 – 22: Devoxx, Paris
  • April 24 – 28: Xamarin Evolve, Orlando

Meetups

  • April 21: Couchbase Silicon Valley User Group – Building a Memory-Centric Data Pipeline with Apache Spark
  • April 26: Virtual JUG
  • April 28: Couchbase LA Meet User- Spark with Couchbase to Electrify Your Data Processing

Couchbase Weekly

News

Media Mentions

  • InfoWorld: NoSQL chips away at Oracle, IBM, and Microsoft dominance
  • CMS Wire: DataStax Gets Multimodel Database Powers
  • CTO Vision: Hortonworks DataFlow 1.2 Released

Blogs

  • Couchbase as a First Class Citizen of Spring Boot 1.4 — Simon Basle
  • Embed Couchbase in an IoT Project for Data Synchronization — Nic Raboy
  • Couchbase Weekly, Apr 11, 2016 — Arun Gupta
  • Moving from MySQL to Couchbase — Nic Raboy

Whitepapers

  • Couchbase Server: An Architectural Overview

Couchbase Weekly 3

Upcoming Events

  • April 20 – 22: Devoxx, Paris
  • April 24 – 28: Xamarin Evolve, Orlando
  • April 27: Mobile Web Dev Conference, San Francisco (Speaking)
  • April 28: Couchbase Day — Denver

Couchbase Meetups

  • April 21: Couchbase Silicon Valley User Group – Building a Memory-Centric Data Pipeline with Apache Spark
  • April 26: Virtual JUG
  • April 28: Couchbase LA Meet User- Spark with Couchbase to Electrify Your Data Processing

Webinars

  • March 18 – April 20: Building a full stack application with NoSQL, Go, and Angular 2
    US Registration
    EMEA Registration

    • 201 – Bootstrapping an application using Couchbase and Go
    • 202 – Application logic, data model, and validation
    • 203 – Build a responsive front end with Angular 2.0 & Bootstrap
    • 204 – Built-in URL permalinking & minification
    • 205 – Mobile-first development with Nativescript

twitter-logo

  • Transitioning from #MySQL to #NoSQL? Learn the key differences between #RDBMS and #Couchbase: http://ow.ly/10AilQ
  • Using #BigData tools in your #NoSQL project? Learn how to load CSV data using #Spark and #Couchbase. http://ow.ly/10AiOb via @DZone
  • Key drivers for use of #opensource – revealed in #FutureOSS results webinar 4/27 @ 2PM ET. Join us: bit.ly/23hL7MI
  • See why companies like IBM, Tableau and Intel are partnering with #Couchbase. Find or become a partner today: http://ow.ly/10n5FB
  • Learn everything you need to know about #NoSQL for free with a new NoSQL Database Podcast: http://ow.ly/10kdIB hosted by #Couchbase

Source: blog.couchbase.com/2016/april/couchbase-weekly-apr18-2016

Monitoring Docker Containers – docker stats, cAdvisor, Universal Control Plane

There are multiple ways to monitor Docker containers. This blog will explain a few simple and easy to use options:

  1. docker stats command
  2. Docker Remote API
  3. cAdvisor
    1. Prometheus
    2. InfluxDB
  4. Docker Universal Control Plane

Lets take a look at each one of them.

We’ll use a Couchbase server to gather the monitoring data.

Lets start the server as:

arungupta/couchbase image is explained at github.com/arun-gupta/docker-images/tree/master/couchbase. It performs:

  • Sets up memory for Index and Data service
  • Configures the Couchbase server for Index, Data, and Query service
  • Sets up username and password credentials

Now lets gather monitoring data.

docker stats

docker stats display a live stream of the following container(s) resource usage statistics:

  • CPU % usage
  • Memory usage, limit, % usage
  • Network i/o
  • Disk i/o

The stats are updated every second.

Here is a sample output:

By default, this command display statistics for all the running containers. A list of container names or ids can be specified, separated by a space, to restrict the stream to a subset of running containers.

For example, stats for only the Couchbase container can be seen as:

where couchbase is the container name.

And the output looks like:

--no-stream option can be specified where only the first snapshot is displayed and results are not streamed.

The Docker Logentries Container can be used to collect this data.

Docker Remote API

Docker daemon provides a Remote REST API. This API is used by the Client to communicate with the engine. This API can be also be invoked by by other tools, such as curl or Chrome Postman REST Client. If you are creating Docker daemons using Docker Machine on OSX Mavericks, then getting this API to work is a bit tricky.

If you are on Mac, follow the instructions in Enable Docker Remote API to ensure curl can invoke this REST API.

The API that provide stats about the container is /containers/{id}/stats or /containers/{name}/stats.

Then more stats about the container can be obtained as:

The following result (formatted) is shown:

There is lot more details on memory, disk, and network. A new set of metrics are pushed every second.

cAdvisor

cAdvisor or Container Advisor provide host and container metrics. It is a running daemon that collects, aggregates, processes, and exports information about running containers.

Let’s start the cAdvisor container:

cAdvisor dashboard shows data for the last 60 seconds only. However multiple backends, such as Prometheus and InfluxDB, are supported that allows long term storage, retrieval and analysis.

Use Couchbase Query Tool to connect with the Couchbase Server:

Invoke a N1QL query:
cAdvisor only store one minute of data and here is a capture of the dashboard:

cadvisor-cpu-usage

And memory usage:cadvisor-total-memory-usage

There are plenty of tools that can use the data generated by cAdvisor and show them in a nice dashboard.

More details are available at github.com/google/cadvisor/tree/master/docs.

Docker Universal Control Plane

Docker Universal Control Plane (DUCP) allows to manage and deploy Dockerized distributed applications, all from within the firewall. It integrates with key systems like LDAP/AD to manage users and provides and interface for IT operations teams to deploy and manage. RBAC, SSO integration with Docker Trusted Registry, simple and easy to use web UI are some of the key features. Read product overview for complete set of features.

Docker Universal Control Plan with Docker Machine is the easiest way to experience this on your local machine. The instructions are very detailed and work out of the box. Here are some images after deploying a Couchbase image.

DUCP installation consists of an DUCP controller and one or more hosts. These are configured in a Docker Swarm cluster. And then containers are started on these clusters:

Docker Universal Control Plane Image


Port mapping is easily defined:

Docker Universal Control Port Mapping

Once the container is running, monitoring stats can be seen:Docker Universal Control Monitoring Stats

And finally the pretty looking dashboard:

Docker Universal Control Plane Dashboard

A client bundle is provided that shows the information about the Docker Swarm cluster as:

There are plenty of tools that provide monitoring data:

  • Sysdig Cloud
  • Docker-Scout
  • Data Dog
  • Ruxit
  • NewRelic
  • Logentries

docker stats and Docker Remote API are certainly the easiest one to give you first snapshot of your monitoring data. And it only becomes interesting from there!

Couchbase Docker Container

Couchbase Docker images are always at hub.docker.com/_/couchbase/. Complete instructions to run Couchbase Docker Container are available at docs.docker.com/engine/examples/couchbase/.

Start Couchbase Docker Container

How do you start a Couchbase Docker container?

By default, this command starts Couchbase Server 4.1 Enterprise Edition. The latest GA images are always available using this image name.

This server needs to be manually configured by going to the Web Console on http://<DOCKERHOST>:8091. The IP address of the Docker Host in my case is obtained using:

The instructions to configure the server are available at at docs.docker.com/engine/examples/couchbase/.

Pre-configured Couchbase Docker Container

If you want a pre-configured server, then you can run the image:

This image is created using Dockerfile and configures the following:

  • Configures the memory
  • Configures Index, Query, and Data service
  • Sets up username/password credentials

Couchbase 4.5 Docker Container

Couchbase 4.5 Developer Preview was launched recently. It can run as a Docker container as:

Notice the image name is couchbase/server:enterprise-4.5.0-DP1.

The Couchbase Web Console is then accessible at http://<DOCKERHOST>:8091. The IP address of the Docker Host in my case is obtained using:

And so the Web Console looks like:

Couchbase 4.5 Developer Preview

After configuring the services, the Console looks like:

Couchbase 4.5 Developer Preview 1 Console

Pre-configured Couchbase 4.5 Docker Container

Now, if you want a pre-configured server, try this:

This image is created using Dockerfile and configures the following:

  • Configures the memory
  • Configures Index, Query, Data, and Full-text service
  • Sets up username/password credentials

So, here are the images you need to use:

Image Purpose
couchbase  Last GA version of Couchbase
couchbase/server  Intermediate builds of Couchbase, such as Developer Preview, Beta, etc
arungupta/couchbase  Last GA version of Couchbase, pre-configured
arungupta/couchbase-server  Intermediate builds of Couchbase, pre-configured

Easy, eh?

Originally published at: http://blog.couchbase.com/2016/february/couchbase-docker-container

Deploy Docker to Amazon Cloud using Tutum

Have you felt the need to run Docker containers on Amazon?

Amazon Container Service requires extensive setup and manual work. This is meant for programmers who have plenty of time and willing to debug through multiple steps. For mundane programmers, like me, who like simple and easy to use steps, there is Docker Tutum!

What is Docker Tutum?

Docker Tutum is a SaaS that allows you to build, deploy and manage Docker containers in a variety of clouds.

Docker Hosting Tutum

There are three main features:

  • Build and run your code using Tutum’s free private registry
  • Deploy applications using Tutum to manage Clusters that are fault tolerant and scalable. Tutum handles the orchestration of your infrastructure and application containers.
  • Manage your applications through Tutum’s intuitive Dashboard, simple API, or CLI tool. With built-in logs and data monitoring, all the info you need is at your fingertips.

The main party line is:

Experience the simplicity of PaaS with none of its constraints. Enjoy the flexibility of IaaS with none of its complexity.

How Docker Tutum Works?

Key Concepts of Docker Tutum

The main concepts of Docker Tutum are explained below:

Docker Tutum Architecture

  • (A) Node clusters are logical groups of nodes of the same type. Tutum pools your nodes resources, so your apps can run together thereby reducing complexity and waste. Node Clusters can be easily scaled with a drag of the slider.
  • (B) Nodes are individual Linux hosts/VMs used to deploy and run your applications. New nodes can be provisioned right from within Tutum to increase the capacity of your Node Clusters.
  • (C) Containers, (D) Links and (E) Volumes are Docker concepts.
  • (F) Services are logical groups of Docker containers from the same image. Services make it simple to scale your application across different nodes. Simply drag a slider to increase or decrease the availability, performance, and redundancy of your application.

Deploy Couchbase Docker Container on Amazon using Tutum

Docker Tutum Getting Started provides detailed steps on how to get started. Here is what I did to run Couchbase Docker container in Amazon using Docker Tutum:

  • Get started for free (at least while its in beta) by logging in using Docker Hub account.
  • Link Amazon Web Services credentials with Tutum. I just had to specify Access Key Id and Secret Access Key.If you create a new account for this then you may have to attach a policy to enable privileges such that new instances can be provisioned on your behalf.
  • Create a new node cluster at dashboard.tutum.co/node/launch/Docker Tutum New Node Cluster
    The three values that need to be specified/changed:

    • Node cluster name
    • Deploy tags (optional)
    • Type/size to t2.medium
    • Disk size reduce from 60 to 20 GB

    Takes a few minutes to provision the AMI. Updated status could be seen on AWS Console:

    Docker Tutum AWS Console

    Tutum dashboard shows the following status after the node is created:

    Docker Tutum Node Created

  • Create your first service at dashboard.tutum.co/container/launch/. Select “Public Repositories” and search for “arungupta/couchbase-node”.
    Docker Tutum New ServiceThis image is created from github.com/arun-gupta/docker-images/tree/master/couchbase-node. This image performs the following:

    • Starts Couchbase server
    • Configures the server using Couchbase REST API
  • Click on “Select” and configure. You only need to override the ports and take all other defaults:
    Docker Tutum Couchbase ConfigurationClick on “Create and Deploy”.
  • Dashboard is updated after the service is deployed:
    Docker Tutum Couchbase Service
  • Click on “Logs” to see logs from the Couchbase Docker container:
    Docker Tutum Couchbase Logs
  • Find IP address from the AWS Console:
    Docker Tutum AWS Console IP Address
  • Access Couchbase Console at <IP-ADDRESS>:8091, in our case 54.67.111.235:8091. This will show the login screen:
    Docker Tutum Couchbase Console Login
    Enter the username “Administrator” and password “password”.
  • This shows the Couchbase Console:
    Docker Tutum Couchbase Console

Create/Access Sample Bucket on Couchbase

  • Click on “Settings”, “Sample Buckets”. This shows the list of sample buckets that can be installed.
  • Select “travel-sample” and click on “Create”. The updated console looks like:
    Docker Tutum Couchbase Travel Sample
  • If you’ve downloaded Couchbase server locally, then you can use Couchbase Query CLI Tool (cbq) to connect and query:
    Couchbase allows to query document database using SQL-like syntax, aka N1QL.

So this blog showed:

  • What is Docker Tutum?
  • How to get started with Docker Tutum?
  • Deploy Couchbase Docker container on Amazon using Tutum
  • Create/Access sample bucket on Couchbase

More details:

  • Docker Tutum Getting Started
  • Docker Tutum Support
  • Docker Tutum Web Dashboard
  • Docker Tutum API
  • Docker Tutum CLI
  • Docker Tutum Python SDK
  • Docker Tutum Go SDK

Enjoy!

Originally posted at: http://blog.couchbase.com/2016/deploy-docker-amazon-cloud-tutum

Docker Machine “client is newer than server” error

Docker 1.9.0 is getting ready to be released. Docker Release Candidate builds can be downloaded from github.com/docker/docker/releases. Matching Docker Machine Release Candidate builds can be downloaded from github.com/docker/machine/releases.

So, you downloaded Docker Machine and Docker CLI Release Candidate build. The latest one at this time is 1.9.0 RC4 for Docker and 0.5.0 RC4 for Docker Machine.

Download is pretty straight forward:

And now Docker Machine:

A big change in Docker Machine is where implementation of drivers such as virtualbox, digitalocean, amazonec2, etc are no longer packaged in the main binary. Instead the distribution is a zip bundle with multiple drivers packaged and referenced from the main binary. These are now packaged separately and has the following benefits:

  1. Each driver can evolve rapidly without waiting for merging into upstream
  2. Additional drivers can be written and used without merging into the upstream
  3. New version of the drivers can be released more frequently. Hopefully more clarity will be available on how these drivers will be distributed.

That’s why installation is slightly different and looks like:

After installation, the Docker Machine can be created as:

And Docker CLI is configured to talk to this machine as:

But now when you try to see the list of images on this machine as docker images, it gives the following error:

This was filed as #2147.

Fortunately, the fix is rather simple even though non-intuitive. Docker Machine needs to be created as:

This is so because use a RC Docker binary require to specify to use a release candidate ISO. This can be done by using -virtualbox-boot2docker-url option as shown.

Now when the Docker Machine is created this way, the empty list of images is shown correctly:

Voila, back in business!

Couchbase Cluster using Docker Compose

Couchbase 4.0 provides lots of features that allows you to develop with agility and operate at any scale. Some of the features that allow you to operate at any scale are:

  • Elastic Scalability
  • Consistent High Performance
  • Always-On Availability
  • Multi-Data Center Deployment
  • Simple and Powerful Administration
  • Enterprise-grade Security

Learn more about these enterprise features at couchbase.com/operate-at-any-scale.

A complete overview is available in Couchbase Server 4.0 datasheet.

This blog will explain how you can easily setup a 3-node Couchbase Cluster using Docker Compose.

Docker Couchbase Cluster

The source code and latest instructions are available at github.com/arun-gupta/docker-images/tree/master/couchbase-cluster.

Create Couchbase Nodes

Couchbase cluster can be easily created using the following Docker Compose file:

This file has service definition for three Couchbase nodes. Admin ports are exposed for only one node as other nodes will talk to each other use Docker-internally assigned IP addresses.

  1. Create three directories ~couchbase/node1, ~couchbase/node2, ~couchbase/node3 – one for each node.
  2. Start three Couchbase nodes as using the docker-compose.yml shown earlier:
    This command is given on a Docker Machine.
  3. Check status of the nodes:
    Docker Compose can also show the status:
  4. Check logs of the nodes:

Configure Couchbase Cluster

Lets configure these nodes to be part of a cluster now.

  1. Find IP address of the Docker Machine:
  2. Access Couchbase Admin Console at http://<DOCKER_MACHINE_IP:8091. This is http://192.168.99.104:8091 in our case. It will show the output as:

    Docker Couchbase Cluster Setup

    Click on “Setup”.

  3. Each container is given an internal IP address by Docker, and each of these IPs is visible to all other containers running on the same host. We need to use these internal IP address when adding a new node to the cluster.Find IP address of the first container:

    Use this IP address to change the Hostname field:

    Docker Couchbase Cluster Node 1

  4. Click on “Next”. Adjust the RAM if necessary. Read more about Couchbase Cluster Settings.
  5. Pick a sample bucket that you’d like to get installed, and click on Next.
  6. Change Per Node RAM Quota from 400 to 100. This is required as we’ll add other nodes later.Docker Couchbase Cluster Per Node RAM Quota
  7. Click on Next, accept T&C, and click on Next.
  8. Enter a password that you can remember as we’ll need this later to add more nodes.

Default view of the cluster looks like as shown:

Docker Couchbase Cluster Default View

Add More Couchbase Nodes

Now, lets add the other two nodes that were created earlier by Docker Compose.

  1. Click on “Server Nodes” to see the default view as:

    Docker Couchbase Cluster Server Nodes Default View

  2. Find IP address of one of the remaining nodes:

  3. Click on “Add Server”, specify the IP address:

    Docker Couchbase Cluster Add Server Node1
    and click on “Add Server”.

  4. Repeat the previous two steps with the server name couchbasecluster_couchbase2_1.

Couchbase Cluster Rebalance

A cluster needs to be rebalanced to ensured that the data is well distributed amongst the newly added or removed nodes. Read more about Couchbase Cluster Rebalance.

Clicking on “Pending Rebalance” tab shows the nodes that have been added to the cluster but are not rebalanced yet:

Docker Couchbase Cluster Pending Rebalance

Click on “Rebalance” and this will automatically rebalance the cluster:

Docker Couchbase Cluster Rebalanced

You just deployed a Couchbase cluster using Docker Compose, enjoy!

Some more references:

  • Couchbase 4 Administration Guide
  • Couchbase 4 Server Architecture
  • Couchbase 4 Cluster Setup

Getting Started with Couchbase using Docker

Couchbase Server 4.0 was recently released and can be downloaded and easily installed. Getting Started with Couchbase explains in very simple and easy steps on how to get started with Couchbase.  But when living in a container world, everything is a Docker image. And Couchbase also has a Docker image.

Couchbase Logo

docker-logo

This blog will explain how you can easily start a Couchbase Server 4.0 as a Docker image.

Install and Configure Docker

Docker is natively supported on Linux. So apt get docker-engine on Ubuntu or yum install docker-engine on CentOS will get you ready to use Docker.

On Mac or Windows, this is achieved by install Docker Machine. Docker Machine to Setup Docker Host explain in detail on how to install and configure Docker Machine.

Here is a brief summary to get you started with Docker:

  1. Download Docker client:
  2. Download Docker Machine script:
  3. Create Docker Machine host:
  4. Setup Docker client to connect to this host:

Now your current shell is configured where the Docker client can run containers on the Docker Machine.

Run Couchbase Docker Container

  1. Starting a Docker container on this machine is pretty straight forward. The CLI downloads the image from Docker Hub and then runs it on the Machine:
    In this CLI, run command runs the container using the image id specified as the last argument, -p publish port 8091 from the container to 8091 on the Docker Machine, -d runs the container in background and prints the container id.
  2. Watch the container status as:
  3. Find out IP address of the Docker Machine:
  4. Access the setup console at 192.168.99.100:8091, make sure to specify the exact IP address in your case. This will show the screen:Couchbase Docker Getting Started 1

Configure Couchbase Server

First run of Couchbase Server requires you to configure it, lets do that next!

  1. Click on the Setup button. Scroll to bottom of the screen, change the Data RAM Quota to 500 (MB-16530), and click on Next.Couchbase Docker Getting Started 2
  2. In Couchbase, data is stored in buckets. The server comes pre-installed with some sample buckets. Select the travel-sample bucket to install it and click on Next.Couchbase Docker Getting Started 3
  3. Configure the bucket by taking defaults:Couchbase Docker Getting Started 4

    Click on Next.
  4. Enter personal details, agree to T&C, click on Next:Couchbase Docker Getting Started 5
  5. Provide administrator credentials:Couchbase Docker Getting Started 6

    Click on Next to complete the installation. This brings up Couchbase Web Console:

    Couchbase Docker Web Console

It takes a few seconds for the travel-sample bucket to be fully loaded. And once that is done, your Couchbase server is ready to roll!

You can also watch the following presentation from Couchbase Connect:

Talk to us at Couchbase Forums or @couchbase.

Kubernetes Application – Package Multiple Resources Together

Deploying an application in Kubernetes require to create multiple resources such as Pods, Services, Replication Controllers, and others. Typically each resource is define in a configuration file and created using kubectl script. But if multiple resources need to be created then you need to invoke kubectl multiple times. So if you need to create the following resources:

  • MySQL Pod
  • MySQL Service
  • WildFly Replication Controller

Then the commands would look like:

Or for convenience, wrap these invocations in a shell script. But that is not very intuitive! There is a better, and more natural and intuitive way.

Kubernetes allow multiple resources to be specified in a single configuration file. This allows to create a “Kubernetes Application” that can consists of multiple resources easily.

Previous section showed how to deploy the Java EE application using multiple configuration files. This application can be delpoyed using a single configuration file as well.

An application, as discussed above, consisting of MySQL Pod, MySQL Service, and WildFly Replication Controller can be created using the following configuration file:

Notice that each section, one each for MySQL Pod, MySQL Service, and WildFly Replication Controller, is separated by ----.

Such an application can be created as:

Complete details about how to setup Kubernetes and run this application are available at github.com/arun-gupta/kubernetes-java-sample/#kubernetes-application.

More details about creating a Kubernetes application with multiple resources can be found in #12104.

You can learn about how to create Kubernetes resources for a Java application, or otherwise, at github.com/arun-gupta/kubernetes-java-sample/.

Getting Started with ELK Stack on WildFly

Your typical business application would consist of a variety of servers such as WildFly, MySQL, Apache, ActiveMQ, and others. They each have a log format, with minimal to no consistency across them. The log statement typically consist of some sort of timestamp (could be widely varied) and some text information. Logs could be multi-line. If you are running a cluster of servers then these logs are decentralized, in different directories.

How do you aggregate these logs? Provide a consistent visualization over them? Make this data available to business users?

This blog will:

  • Introduce ELK stack
  • Explain how to start it
  • Start a WildFly instance to send log messages to the ELK stack (Logstash)
  • View the messages using ELK stack (Kibana)

What is ELK Stack?

ELK stack provides a powerful platform to index, search and analyze your data. It uses  Logstash for log aggregation, Elasticsearch for searching, and Kibana for visualizing and analyzing data. In short, ELK stack:

  • Collect logs and events data (Logstash)
  • Make it searchable in fast and meaningful ways (Elasticsearch)
  • Use powerful analytics to summarize data across many dimensions (Kibana)

logstash-logo

Logstash is a flexible, open source data collection, enrichment, and transportation pipeline.

Logstash

elasticsearch-logo

Elasticsearch is a distributed, open source search and analytics engine, designed for horizontal scalability, reliability, and easy management.

Elasticsearch

kibana-logo

Kibana is an open source data visualization platform that allows you to interact with your data through stunning, powerful graphics.

Kibana

How does ELK Stack work?

Logstash can collect logs from a variety of sources (using input plugins), process the data into a common format using filters, and stream data to a variety of sources (using output plugins). Multiple filters can be chained to parse the data into a common format. Together, they build a Logstash Processing Pipeline.

Logstash Processing Pipeline

Inputs and outputs support codecs that enable you to encode or decode the data as it enters or exits the pipeline without having to use a separate filter.

Logstash can then store the data in Elasticsearch and Kibana provides a visualization of that data. Here is a sample pipeline that can collect logs from different servers and run it through the ELK stack.

ELK Stack

Start ELK Stack

You can download individual components of ELK stack and start that way. There is plenty of advise on how to configure these components. But I like to start with a KISS, and Docker makes it easy to KISS!

All the source code on this blog is at github.com/arun-gupta/elk.

  1. Clone the repo:
  2. Run the ELK stack:
    This will use the pre-built Elasticsearch, Logstack, and Kibana images. It is built upon the work done in github.com/nathanleclaire/elk.

    docker ps will show the output as:

    It shows all the containers running.

WildFly and ELK

James (@the_jamezp) blogged about Centralized Logging for WildFly with ELK Stack. The blog explains how to configure WildFly to send log messages to Logstash. It uses the highly modular nature of WildFly to install jboss-logmanager-ext library and install it as a module. The configured logmanager includes @timestamp field to the log messages sent to logstash. These log messages are then sent to Elasticsearch.

Instead of following the steps, lets Docker KISS and use a pre-configured image to get you started.

Start the image as:

Make sure to substitute <DOCKER_HOST_IP> with the IP address of the host where your Docker host is running. This can be easily found using docker-machine ip <MACHINE_NAME>.

View Logs using ELK Stack

Kibana runs on an embedded nginx and is configured to run on port 80 in docker-compose.yml. Lets view the logs using that.

  1. Access http://<DOCKER_HOST_IP> in your machine and it should show the default page as:ELK Stack WildFly PatternThe @timestamp field was created by logmanager configured in WildFly.
  2. Click on Create to create an index pattern and select Discover tab to view the logs as:ELK Stack WildFly Output

Try connecting other sources and enjoy the power of distributed consolidated by ELK!

Some more references …

  • Logstash docs
  • Kibana docs
  • Elasticsearch The Definitive Guide

Distributed logging and visualization is a critical component in a microservices world where multiple services would come and go at a given time. A future blog will show how to use ELK stack with a microservices architecture based application.

Enjoy!